
Figure 6.
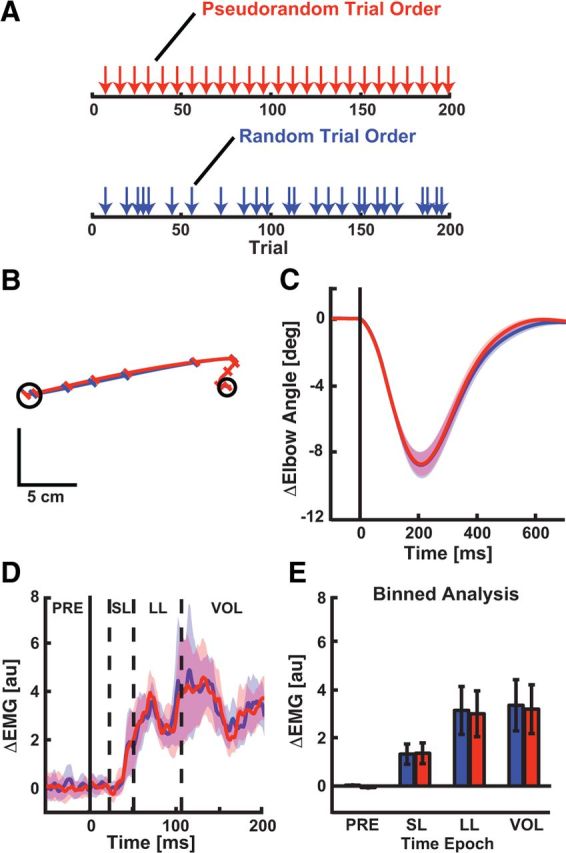
Corrective responses for different perturbation schedules. A, Schematic showing the order of perturbation trials in fixed (unperturbed trials randomized, perturbation trials inserted on every eighth reaching trial; top, red arrows) and random trial blocks (unperturbed and perturbed reaching trials randomized; bottom, blue arrows). B, Exemplar data from a single subject showing corrective responses elicited by a mechanical perturbation. Black, red, and blue traces correspond to average responses obtained during the baseline, late adaptation, and washout phases. Diagonal tick marks correspond to the hand position every 100 ms. C, Population-level elbow joint kinematics evoked by mechanical probe trials. Data are aligned to perturbation onset (t = 0 ms; mean ± SEM). Negative changes in elbow angles represent extension motion caused by the perturbation. D, Population averages showing perturbation responses of the brachioradialis muscle (mean ± SEM). Red and blue traces correspond to brachioradialis responses in the pseudorandom and random trial blocks. E, Binned analysis of brachioradialis perturbation responses (mean ± SEM). *p < 0.05, **p < 0.01, ***p < 0.001.