Figure 8.
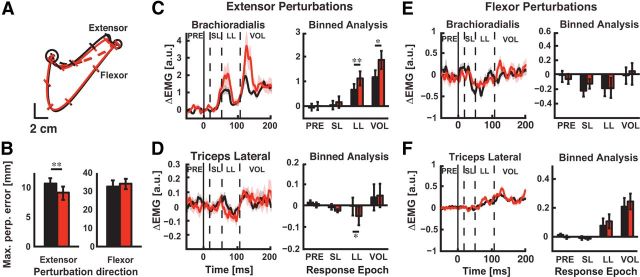
Adaptation of LL responses is sensitive to the direction of the training load. A, Representative data from a single subject showing corrective responses across the training paradigm with the brachioradialis muscle preloaded. Black trace corresponds to trajectories during unloaded reaching (baseline); red traces are trajectories from the adaptation phase (viscous elbow load). Solid lines correspond to probe trials (± 2 Nm step-torque perturbation) and the dashed lines represent unperturbed trajectories. B, Summary plot showing maximum perpendicular hand motion (mean ± SEM) caused by perturbations that extended (left) or flexed (right) the elbow. C, Brachioradialis stretch responses evoked by elbow extensor perturbations. Left panel: Mean perturbation-evoked activity of the brachioradialis muscle for mechanical perturbations that extended the elbow. Vertical dashed lines demarcate the time epochs used to characterize muscle stretch responses. Horizontal axis is the time relative to perturbation onset (t = 0 ms; solid vertical line). Shaded regions indicate the SEM with black and red shading corresponding to brachioradialis activity in the baseline and adaptation phases, respectively. Right, Binned analysis of brachioradialis stretch responses for perturbations that extended the elbow. D, Triceps lateral stretch responses evoked by elbow extensor perturbations. Left, Mean perturbation-evoked activity of the triceps lateral muscle for extensor perturbations. Data are plotted in the same format as in C, Right, Binned analysis of triceps lateral stretch responses for perturbations that extended the elbow. E, Brachioradialis stretch responses evoked by elbow flexor perturbations. Left, Mean perturbation-evoked activity of the brachioradialis muscle for perturbations that flexed the elbow. F, Triceps lateral stretch responses evoked by perturbations that flexed the elbow. Left, Mean perturbation-evoked activity of the triceps lateral muscle. Right, Binned analysis of triceps lateral responses. Data are plotted in the same format as panel C. *p < 0.05, **P < 0.01, ***p < 0.001.

