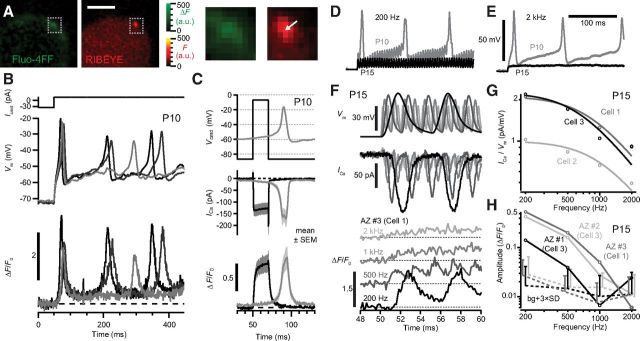
Figure 1.
Naturalistic synaptic Ca2+ signal in IHCs before and after hearing onset. A, Change in fluorescence of the Ca2+ indicator Fluo-4FF (green) in a P10 IHC reveals a hotspot, colocalizing with the ribbon (red) marked by the fluorescent peptide (2 μm dimer). Scale bar, 3 μm. Boxes enlarged to the right. B, Small depolarizing current pulses (Icmd, top) applied to a prehearing IHC elicited APs (middle), overlay of three pulses. The normalized fluorescence change of Fluo-4FF (ΔF/F0) at a synaptic ribbon indicated transient Ca2+ influx (bottom) during each AP. C, Top, Immature IHCs were stimulated with a square depolarization or with the recorded waveform of a Ca2+ AP (Vcmd). The whole-cell Ca2+ current (ICa, middle) and ΔF/F0 (bottom) were similar for the two stimuli. ΔF/F0 traces are grand averages of 10 repetitions for each AZ (8 AZs in 4 IHCs). D, E, Differential responses of the membrane potential of a P10 (gray) or P15 (black) IHC in response to inwardly rectified sinusoidal current of 200 pA peak-to-peak amplitude at 200 Hz (D) and 2 kHz (E). F, The temporally compressed response of a P15 IHC to 200 Hz, 1 nA amplitude current was presented to IHCs in voltage clamp. Membrane potentials (Vm, top, corrected for attenuation as predicted by a resistor–capacitor circuit model), measured ICa (middle), and ΔF/F0 of Ca2+ indicator at an AZ (bottom) from a P15 IHC (AZ #3 in Cell 1, as in H) stimulated at four frequencies. Robust ΔF oscillations were observable up to 500 Hz. G, Amplitude of ICa (open circles) estimated as the fast Fourier transform magnitude at the stimulus frequency, normalized to Vm. Solid curves are fits to a filter function for three IHCs (see Materials and Methods). H, ΔF/F0 oscillation amplitudes of three AZs from two IHCs of similar ICa amplitude, estimated as the fast Fourier transform magnitude at the stimulus frequency. Dotted lines and error bars represent the mean and variation (3× SD) of background (bg) noise within ±100 Hz of the stimulus frequency, offset on x-axis for clarity. In these three AZs, the ΔF/F0 oscillation fell to noise level ≤2 kHz.

