
Figure 3.
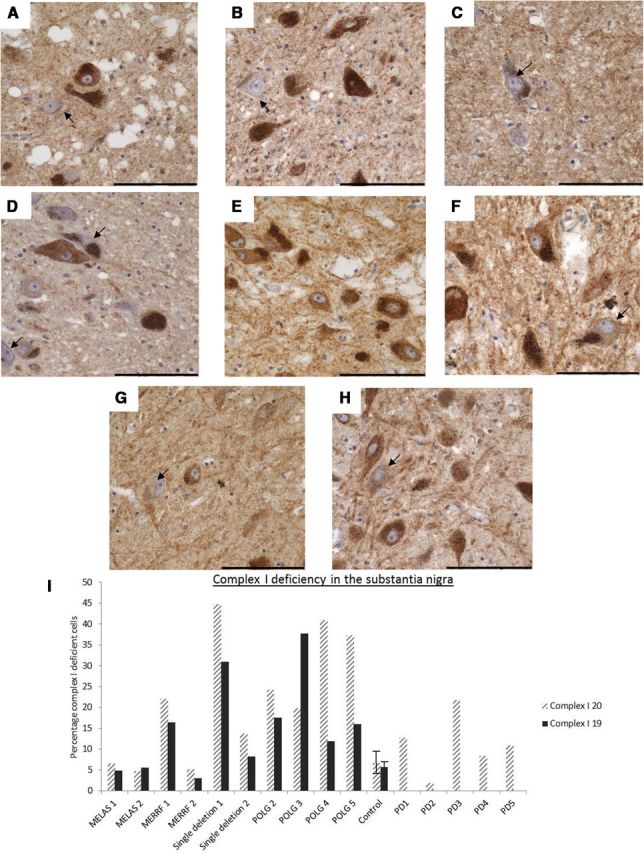
Complex I immunohistochemistry showing the variable degree of protein deficiency in SN neurons. Pigmented SN neurons with a deficiency in complex I subunits (arrows) were found in all cases and controls; however, the level of deficiency varied. A–H, Images show staining for CI20 (A–D) and CI19 (E–H), and the arrows indicate neurons showing deficiencies for these proteins. for these proteins. Deficiencies in the expression of these proteins were found in patients with point mutation (B, F), POLG/multiple deletions (C, G), and controls (D, H). Images were taken at a 40× magnification. Scale bar, 100 μm. I, The number of complex I-deficient neurons was then expressed as a percentage of the total counted neurons. Error bars show SD of controls (n = 10) and PD cases (n = 5).