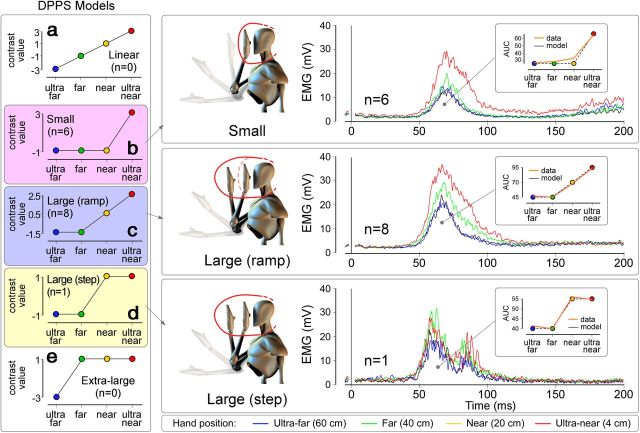
Figure 2.
Interindividual variability in DPPS size. Left, One model representing a linear increase of HBR magnitude with hand–face proximity (a) and four models representing different DPPS sizes (b–e). Models c and d both represent a large DPPS and differ only for the presence or absence of a further increase within the DPPS. Single-subject data were tested against each model. All but one subject best fitted either model b or model c. Right, Group-average HBR waveforms of the participants whose data best fitted model b (N = 6; top), model c (N = 8; middle), and model d (N = 1; bottom). None of the participants' data fitted model a. Insets, The HBR magnitude is expressed as the AUC (in arbitrary units).

