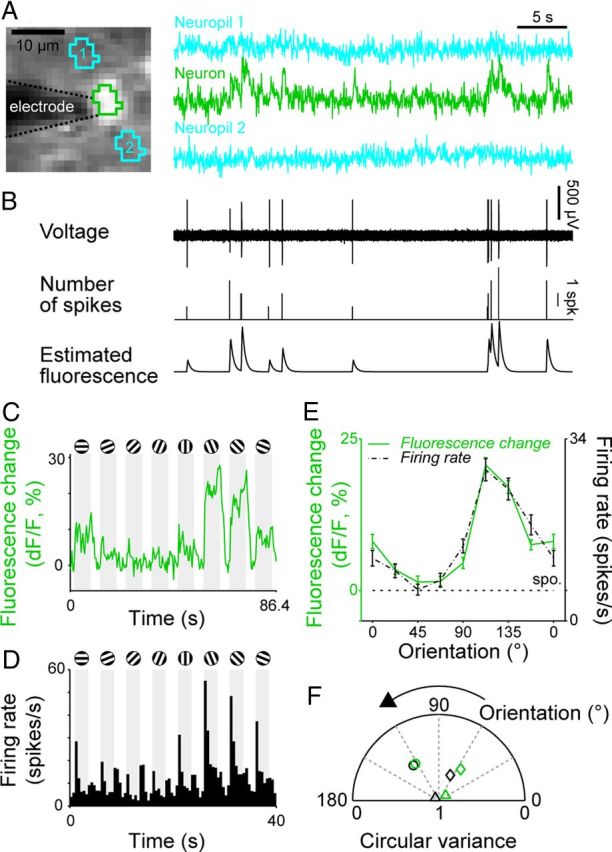
Figure 2.

Relationship between fluorescence signals and spiking activities of neurons. A, Fluorescence signals from a V1 neuron and two nearby regions. Left, A structural image during recording. The brighter portion in the center is the recorded neuron. The darker portion to the left of the neuron is the recording electrode. Right, Fluorescence signals over a period of 35 s with no visual stimulation. Fluorescence signal of a neuron (second row) was extracted from the region enclosed by green lines seen in the left part. Blue traces (first and third rows) were fluorescence signals from nearby neuropils enclosed by blue lines seen in the left part. B, Upper, Voltage signal obtained from the neuron simultaneously recorded with fluorescence signal. Middle, A histogram showing the number of spikes in one time bin (time bin width = 38 ms). Bottom, Estimated fluorescence from spiking activities. C, D, Fluorescence change (dF/F) and firing rate (poststimulus time histogram) of another V1 neuron in response to gratings of various orientations. Responses were averaged across 60 stimulus presentations for the fluorescence change and 30 stimulus presentations for the firing rate. Shading indicates periods of stimulus presentation. E, Orientation tuning curves based on the fluorescence signal amplitude (C) and the spike firing rate (D). Error bars indicate SEM. F, Preferred orientation and tuning strength of three neurons (denoted by 3 different symbols) determined from fluorescence signal (green) and spike firing rate (black). CV and preferred orientation were shown as radius and azimuth in a circular plot, respectively.
