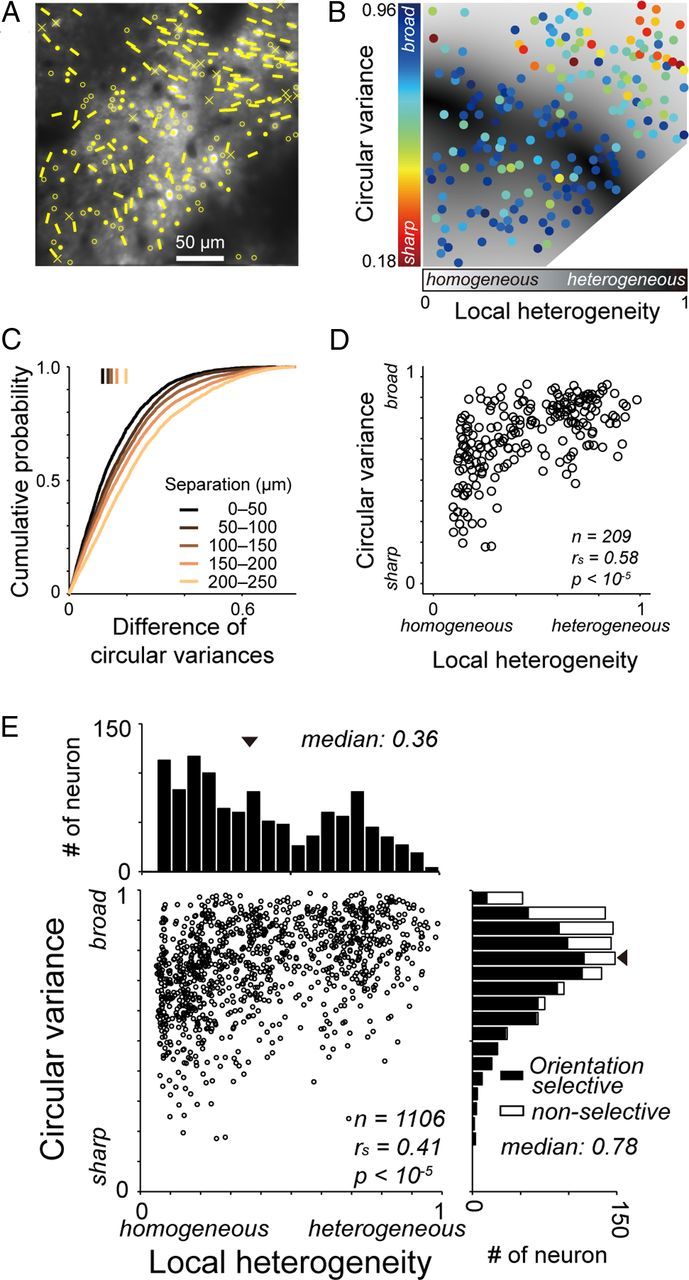
Figure 4.

Arrangement of neurons according to their orientation tuning strength. A, Orientation preference map in layer 2 superimposed on a structural image. Crosses denote visually nonresponsive cells. Other conventions are the same as those in Figure 3C. B, A map of the orientation tuning strength (CV) and the local heterogeneity of preferred orientations (local heterogeneity index). The colors of dots indicate the CV of neurons at the dot positions. The gray level of background pixels indicates the local heterogeneity index. C, Cumulative plots of the difference in CV between two neurons by physical separation between the neurons. Vertical bars: median values of the differences for five groups of distances between the neurons. D, Plots of CVs against local heterogeneity indices for the recording region shown in B. E, Population data of CVs and local heterogeneity indices for 1106 neurons in 10 imaged regions.
