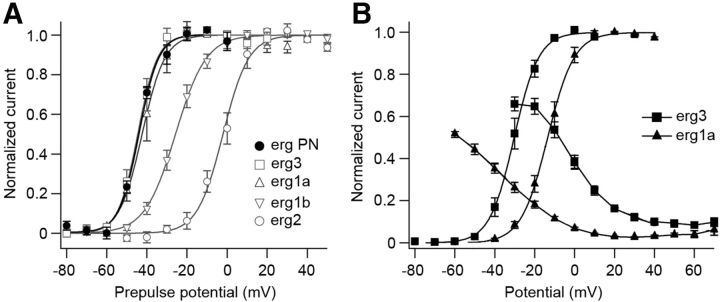
Figure 6.
Comparison of biophysical properties of native and heterologously expressed erg currents. A, Voltage dependence of erg current activation, external solution, 40 mm K+. Measurements were made in Purkinje cells and in HEK293 cells following transient transfection of erg1a, erg1b, erg2, or erg3. Activation protocol as in Figure 4. Bolzmann fits to the mean values of the activation curves yielded V1/2 and k values as given in Table 3. B, Voltage-dependent activation and inactivation recorded in HEK293 cells transiently transfected with erg1a or erg3. External solution, 5 mm K+, 1 mm Ca2+. Activation protocol as in Figure 4. Bolzmann fits to the mean values of the activation curves yielded the following V1/2 and k values, respectively: erg3 (−30.3 mV, 6.2 mV; n = 6), erg1a (−13.5 mV, 6.7 mV; n = 6). Inactivation curves were measured in the same external solution using the following pulse protocol: from a holding potential of −20 mV, a 10 ms (erg1a) or 5 ms (erg3) pulse to −100 mV was followed by 100 ms potential steps from −100 to 70 mV in steps of 10 mV. Steady-state inactivation for each potential was determined from the ratio of the steady-state and initial peak current.

