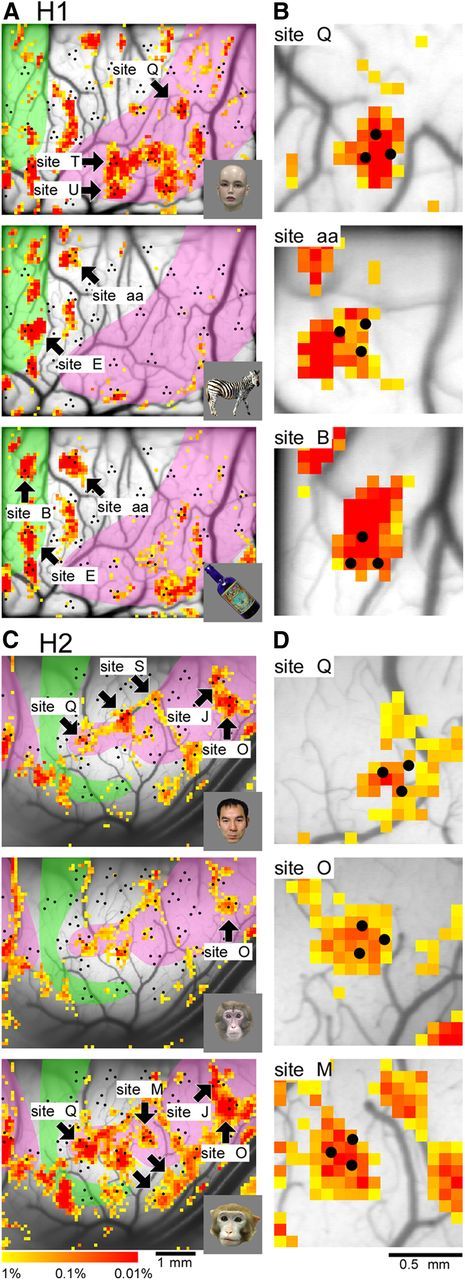
Figure 10.

Relationship of domains to feature columns. A–D, Spatial patterns of intrinsic signals elicited by objects (lower right insets) in H1 (A, B) and H2 (C, D). B and D represent magnified views of representative sites in A and C, respectively. Color indicates p value representing statistically significant difference between trials with stimulus and trials without stimulus (blank screens; t test, p < 0.01). The shaded regions represent an anti-face domain in green and face domain in pink determined by the hierarchical clustering (Fig. 2B,D). Electrophysiological recording sites are indicated by black dots as in Figure 2B,D.
