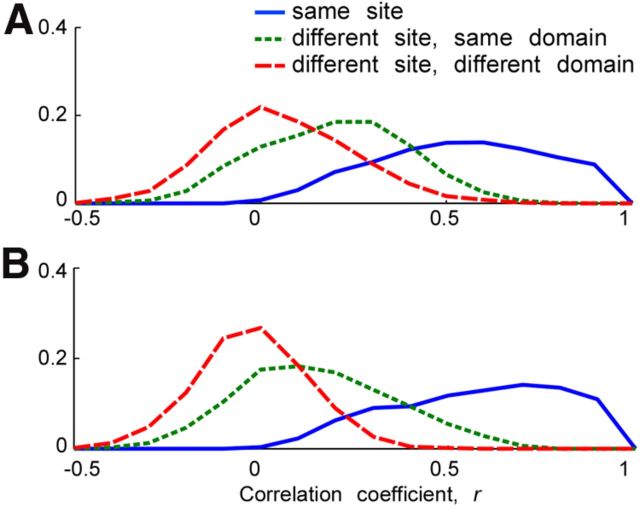
Figure 11.
Relationship among MUs within site, within domain, and across domains. A, B, The distribution of MU pairs against correlation coefficient between their stimulus response vectors in H1 (A) and H2 (B). Only the MU pairs with the distance <1 mm are counted to ensure that the response similarity was due to local (presumably columnar) structure rather than simply proximity. We plotted MU pairs taken from within a site (blue), different sites but in the same domain (green), and different domains (red) separately. Vertical axis, frequency of MU pairs with the correlation coefficient indicated in horizontal axis.

