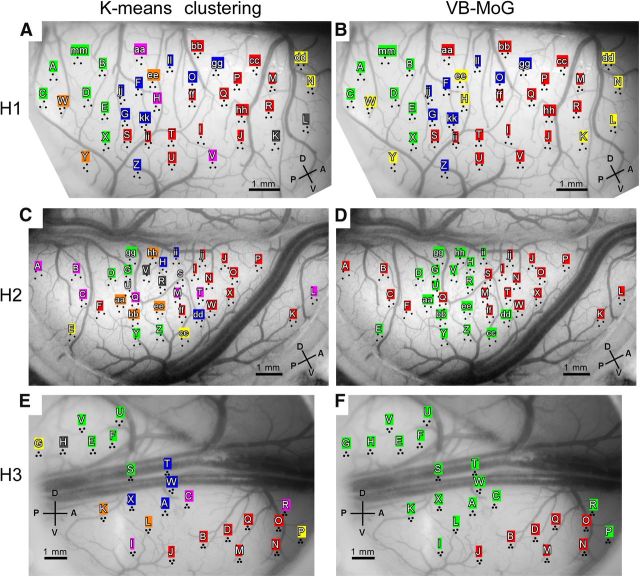
Figure 4.
The results of different clustering analyses. A–F, Resulting grouping of sites is indicated on the cortical surface using the same color for sites belonging to each group in H1 (A, B), H2 (C, D), and H3 (E, F). The analyses were k-means clustering (A, C, E) and clustering using the VB-MoG (B, D, F). Other conventions are the same as in Figure 2, B, D, and F.

