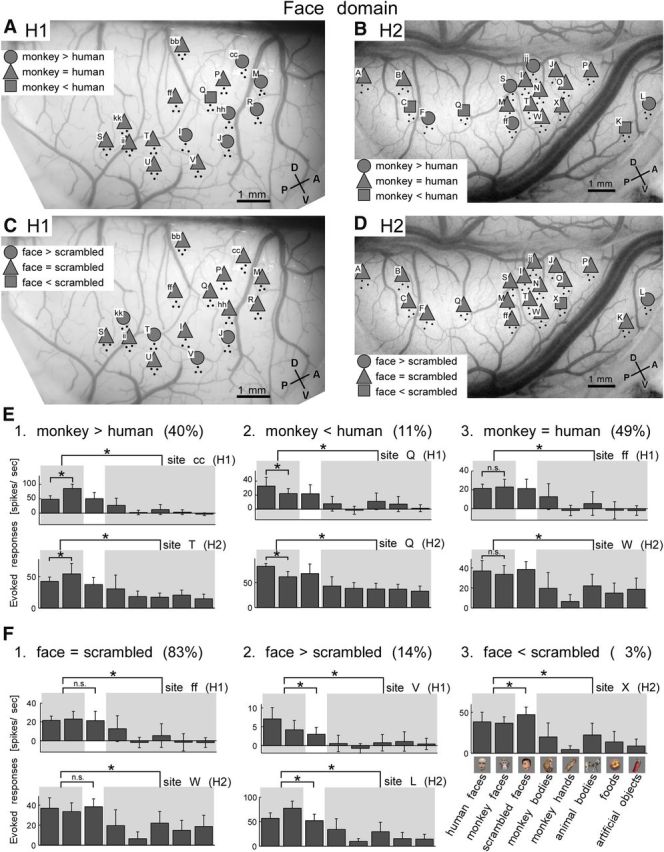
Figure 8.

Heterogeneous selectivity within face domains. A, B, Spatial patterns of sites with differential responses to monkey and human face subcategories for H1 (A) and H2 (B). Sites within face domains (Domain I in both H1 and H2) determined by the hierarchical clustering are plotted (Fig. 2B,D). Circles represent the sites showing significantly stronger evoked responses to monkey faces than human faces (t test, p < 0.05). Squares indicate stronger sites to human faces than monkey faces (t test, p < 0.05). Triangles indicate no significant difference between monkey and human faces. C, D, Spatial patterns of sites with differential responses to normal face and scrambled face subcategories in face domains for H1 (C) and H2 (D). Circles represent the sites showing significantly stronger evoked responses to normal faces than to scrambled faces (t test, p < 0.05). Squares indicate sites with stronger evoked responses to scrambled faces than to normal faces (t test, p < 0.05). Triangles indicate no significant difference between evoked responses to normal faces and evoked responses to scrambled faces. E, F, Representative sites in face domains showing differential selectivity for human and monkey faces (E) and for normal faces and scrambled faces (F). For each selectivity type, the number in parentheses gives percentage of the number of the sites with the selectivity in total number of sites within face domains across two hemispheres, H1 and H2 (n = 35). The stimulus category of each bar is given in lower right with representative stimuli. Shading contrasts face and nonface categories. Asterisks indicate statistically significant differences (t test, p < 0.05). Error bars represent SD of responses evoked by different objects in individual categories.
