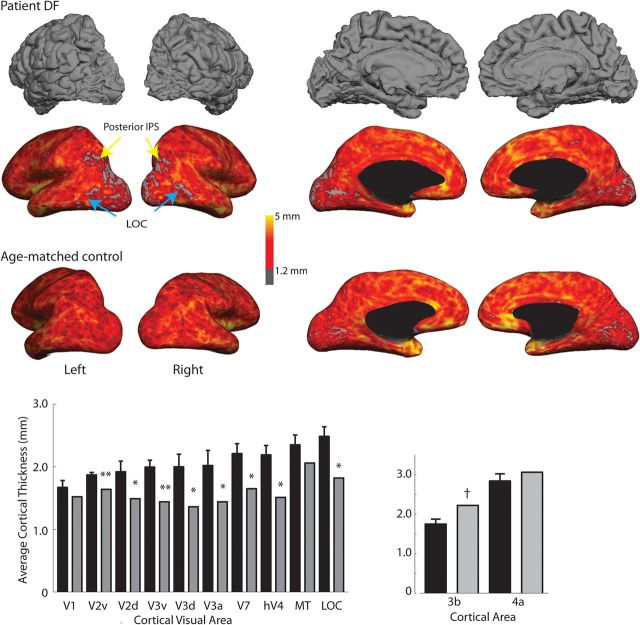
Figure 1.
Cortical thickness is significantly reduced in extrastriate regions in DF compared with age-matched control participants. The top row shows the pial surface of DF's brain. Frontal and temporal regions appear to show normal gyrification, but the occipital cortex shows considerable reduction in gray matter, particularly on the lateral surface. The red scale for DF's brain in the second row indicates a quantification of the gray matter thickness. The arrows indicate areas LOC (cyan) and posterior IPS (yellow) in which the cortical thickness is <1.2 mm. Comparable data for an age-matched female control are shown below. The asterisks in the bottom left indicate visual cortical areas, for which the cortex in DF (gray bars) is significantly thinner than controls (black bars) across both hemispheres (using CGP-modified t tests from Crawford et al. (2010), with *p < 0.05 and **p < 0.01; see also Table 1). Only areas V1 (right hemisphere only) and MT do not differ from control participants. Cortical thickness for dorsal and ventral regions of V2 and V3 (V2d, V2v, V3d, V3v) are shown separately for comparison with retinotopic mapping results in Figure 3. Brodmann area 3b, indicated by † and used as a control region, is significantly thicker in DF than control participants.

