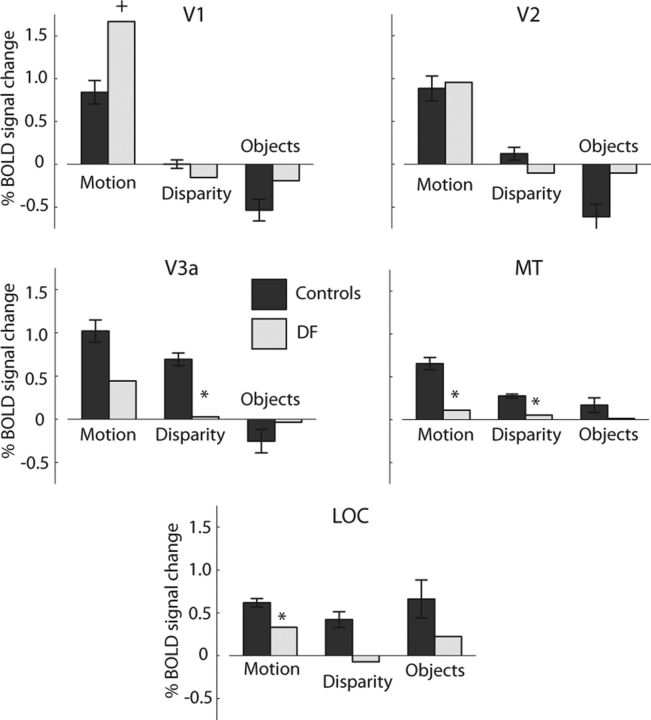
Figure 6.
Summary of activations to motion-defined, disparity-defined, and object stimuli in control participants and DF. Areas showing activity significantly lower than the control mean (CGP-modified t test, p < 0.05) are shown by *. The activity to motion stimuli in V1 is significantly greater in DF than the control mean (CGP-modified t test, p < 0.05), denoted by †.

