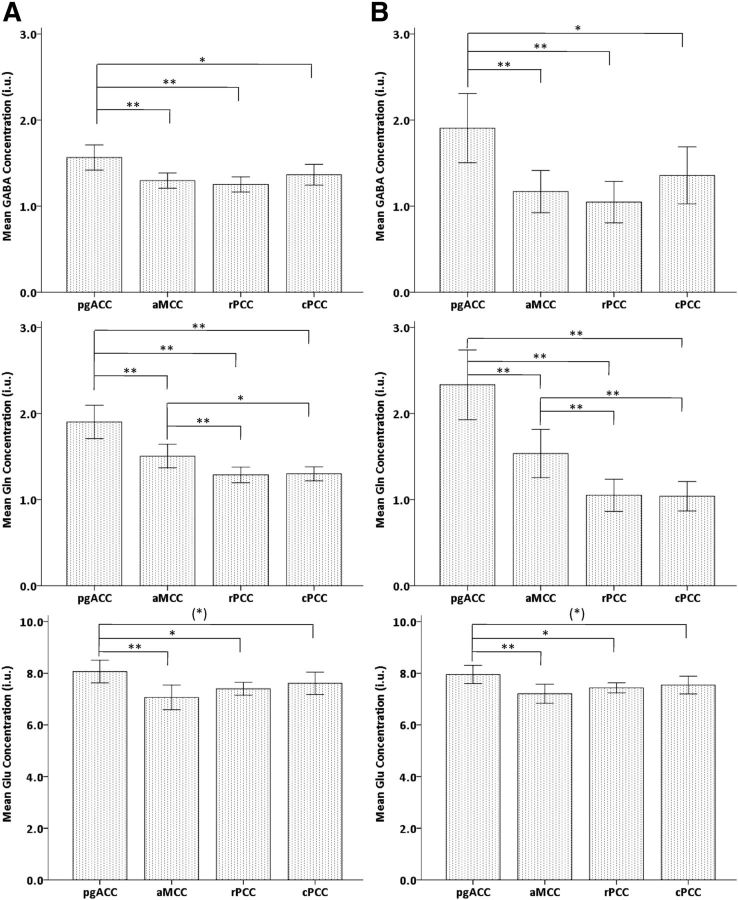
Figure 6.
Mean levels of metabolite concentrations of GABA (top), Gln (middle), and Glu (bottom) before (A) and after (B) correction for the GM content in pgACC, aMCC, rPCC, and cPCC regions with error bars indicating ± 2 SE [**p < 0.01; * p < 0.05; (*)p < 0.1]. The metabolite concentrations are expressed in i.u.

