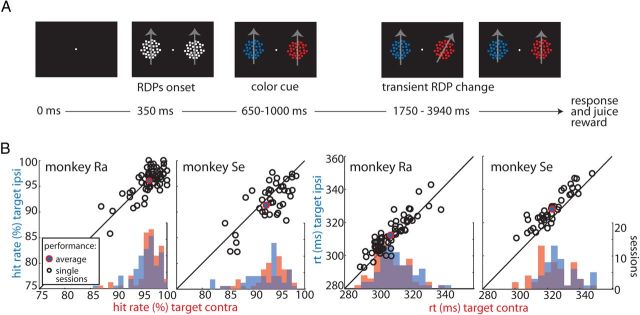
Figure 1.
Task and behavioral performance. A, TDT trial sequence. Black panels represent the screen across the duration of the example trial. The target and distracter stimuli were defined using a color-rank rule (for details, see Materials and Methods). Gray arrows indicate the RDPs motion direction and are for visualization purposes only. B, Hit rates and reaction times (rt) as a function of target position (red, target contralateral; blue, target ipsilateral) for both animals. Black open circles represent single-session performances during TDT. The solid blue–red circles indicate average performances across sessions during TDT.

