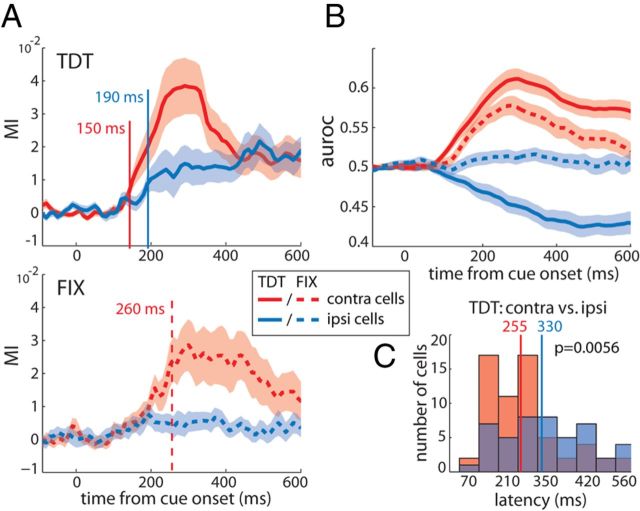
Figure 4.
Target selection of contralateral versus ipsilateral groups of cells. A, Average MI as a function of time from cue onset for contralateral (red, n = 62) and ipsilateral (blue, n = 47) populations of cells during TDT (top, solid lines) and FIX (bottom, dashed lines). Red and blue vertical lines represent the time point when the average MI was first significantly different from zero for contralateral and ipsilateral groups, respectively (Wilcoxon's signed-rank tests for significant differences from zero, p < 0.05 during at least 5 consecutive bins). Note that no latency could be obtained for ipsilateral cells during FIX. Shaded areas represent SEM. B, Average target selectivity assessed using auroc across time. The same color and line coding as in A applies. C, Distributions of TDT selection latencies across single contralateral (red) and ipsilateral (blue) cells (Wilcoxon's rank-sum test evaluated at p < 0.05).

