
Figure 3.
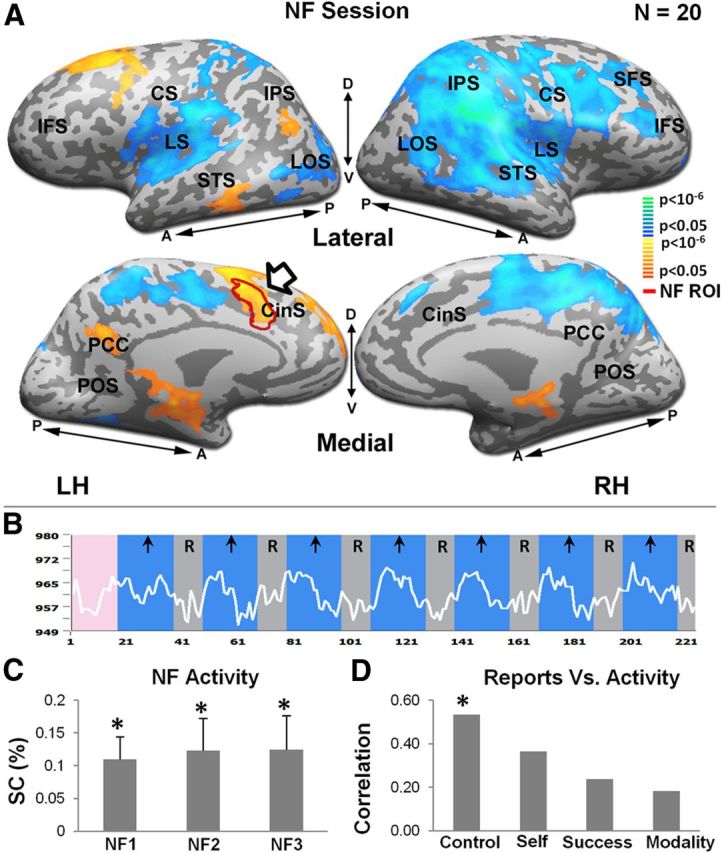
NF session. A, Activity maps for the NF session dACC-elevating versus rest. Activity maps from multisubject (n = 20), random-effect GLM analysis (corrected for multiple comparisons) are presented in lateral (L) and medial (M) inflated format. Color scale indicates statistical significance. Yellow-orange regions represent areas that were preferentially activated in the dACC-elevating blocks, whereas blue-green regions represent areas that were preferentially activated during rest. The NF target ROI (dACC, defined for each subject individually, see Materials and Methods) is indicated by red contour and arrow. LH indicates left hemisphere; RH, right hemisphere; M, medial; L, lateral; A, anterior; P, posterior; CS, central sulcus; SFS, superior frontal sulcus; CinS, cingulate sulcus; LTC, lateral temporal cortex; IFS, inferior frontal sulcus; IPS, intraparietal sulcus; LS, lateral sulcus; PCC, posterior cingulate cortex; P, posterior. B, Example NF time course from the dACC for a typical subject. Blue and gray epochs represent dACC-elevating blocks and rest periods, respectively. C, Average activity from dACC for dACC-elevating condition for each NF run. Asterisks denote statistical significance relative to rest baseline. Error bars indicate SEM. *p < 0.05. D, Correlation between subjects' dACC BOLD activation and their reports regarding their NF strategy (corrected for multiple comparisons). Asterisk denotes statistical significance. *p < 0.05. For the questionnaire details, see Materials and Methods.