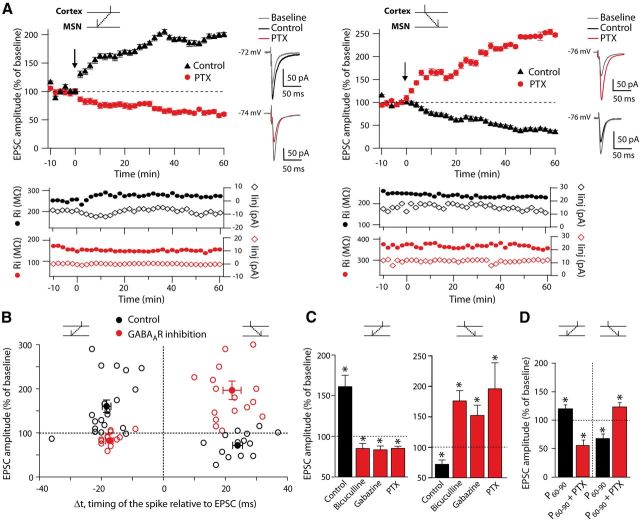
Figure 1.
GABAAR inhibition reverses the STDP. (A) Representative STDP experiments illustrating the time courses of plasticity induced by post-pre and pre-post pairings in control conditions and with PTX (50 μm). In control conditions (black traces), post-pre and pre-post pairings induced LTP and LTD, respectively, as illustrated by EPSCs (averages of 10 raw traces) evoked before (gray traces) or after (black and red traces) the STDP protocol. With PTX, post-pre pairings induced LTD and pre-post pairings induced LTP (red traces). Low traces show monitoring of input resistance (filled circles) and holding current (diamonds) during the entire experiment in control (black) and picrotoxin (red) conditions. This illustrates the stability of the recordings along time for the different experimental conditions. B, Summary graphs showing that GABAAR blockade reversed STDP polarity (control: black circles; GABAAR inhibition [PTX, bicuculline, and gabazine]: red circles). Each empty symbol represents one neuron and filled symbols are the averages. C, Summary bar graphs showing the inversion of plasticity after GABAAR inhibition with bicucculline (20 μm), gabazine (10 μm), or PTX (50 μm). Post-pre pairings (left) induced LTP in control and LTD after GABAAR inhibition by any of the three treatments; conversely, pre-post pairings (right) induced LTD in control and LTP with GABAAR inhibition. D, The reversion of STDP polarity by PTX is also observed in adult animals (P60-P90) as illustrated by the summary bar graph. In control conditions, post-pre and pre-post pairings induced LTP (121.0 ± 6.0%, p < 0.05, n = 9) and LTD (69.4 ± 7.1, p < 0.01, n = 7), respectively. When GABAARs were blocked with PTX (50 μm), post-pre pairings induced LTD (56.4 ± 9.0%, p < 0.05, n = 3) and pre-post pairings induced LTP (125.0 ± 7.0, p < 0.05, n = 5). The black arrows indicate the STDP protocol induction. Data: mean ± SEM. *p < 0.05.

