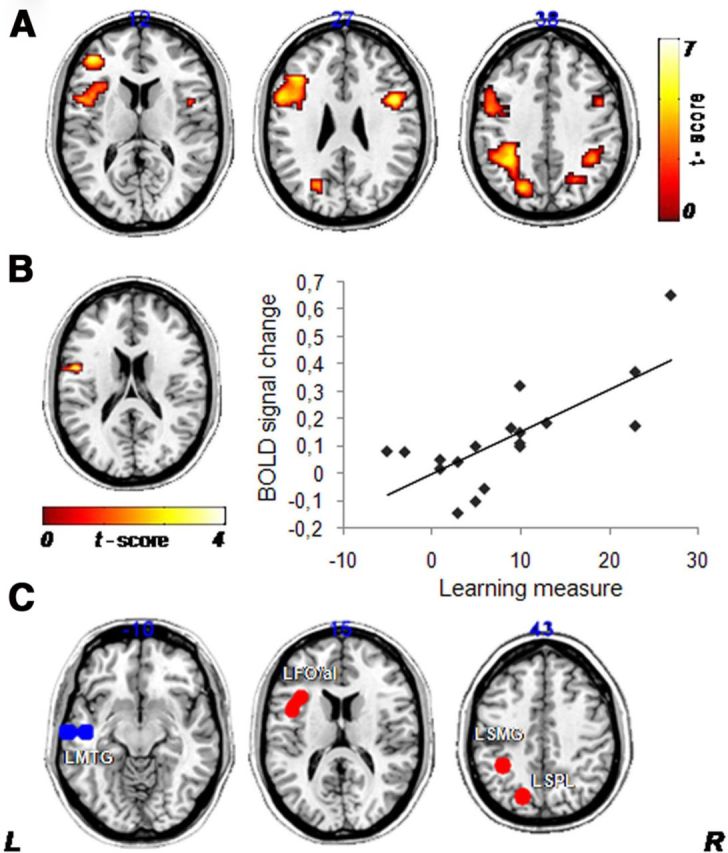
Figure 4.

Results of the phoneme identification fMRI task. A, Posttraining versus pretraining nonnative contrast: statistical parametric maps representing the comparison of posttraining versus pretraining brain activity during the nonnative contrast (nonnative minus noise) corrected for multiple comparisons (FWE correction at p < 0.05 determined by Monte Carlo simulation). Similar to the results of Golestani and Zatorre (2004), the effects of nonnative contrast training resulted in increased functional activity in the bilateral FO/aI, LSPL, and LSMG. There were no significant differences in the comparison of posttraining and pretraining for the native contrast. B, Performance correlates of fMRI data: the left inferior frontal gyrus (BA 44 at MNI coordinates −54, 3, 27; z value, 3.51) was positively correlated with the learning measure (posttraining minus pretraining identification scores) recorded inside the scanner during the presentation of the posttraining nonnative contrast (p < 0.05, FWE corrected at the cluster level). C, ROI definition: Illustration of the seed regions selected for the rs-FC analysis obtained by spheres of 8 mm radius centered on peaks of the ROIs derived from task-related fMRI data. This procedure lets us identify the brain areas involved in (1) processing of the nonnative contrast, Posttraining Nonnative > Pretraining Native (LFO/aI, LSPL, and LSMG; red) and (2) processing of the native contrast, Pretraining Native > Posttraining Nonnative (LMTG; blue). L, Left; R, right.
