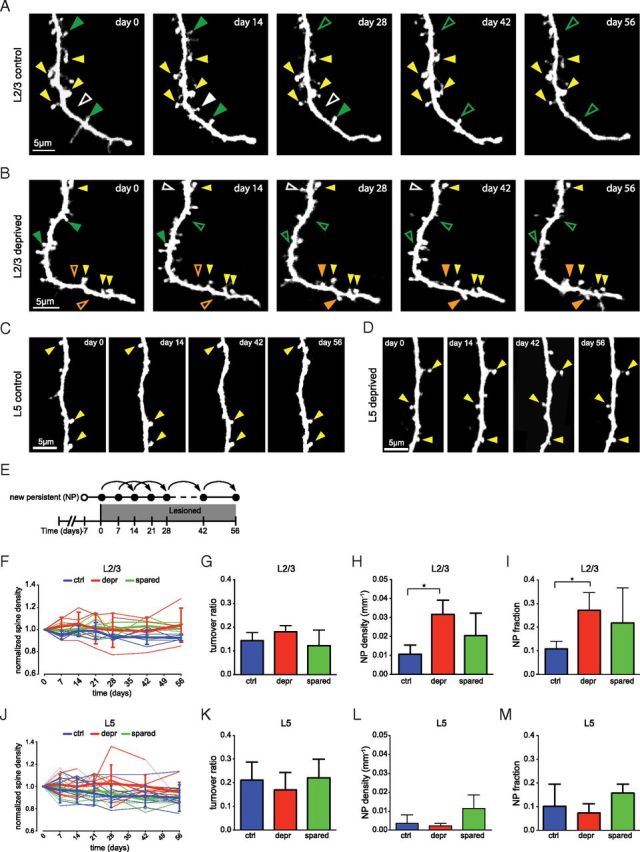
Figure 6.

Pyramidal dendritic spine dynamics. A–D, High-magnification view of L2/3 cell (A, B) and L5 cell (C, D) dendrites imaged at different time points in control (A, C) and deprived (B, D) barrel columns. Arrowheads: yellow, stable spine; orange, new spine; green, lost spine; white, transient spine. (E) Scoring of NP spines. New spines that survived for a minimum of 14 d were scored as NP. F, J, Normalized L2/3 cell (F) and L5 cell (J) spine densities as a function of time. Thin lines, individual cells; thick lines, averages. G, K, Turnover of L2/3 cell (G) and L5 cell (K) spines between imaging sessions. H, L, The cumulative NP spine density for L2/3 cells (H) and L5 cells (L). I, M, Cumulative NP fraction: the total number of NP spines as a fraction of the number of spines present on day −7 calculated for L2/3 cells (I) and L5 cells (M). Color code: control, blue; deprived, red; spared, green. *p < 0.05.
