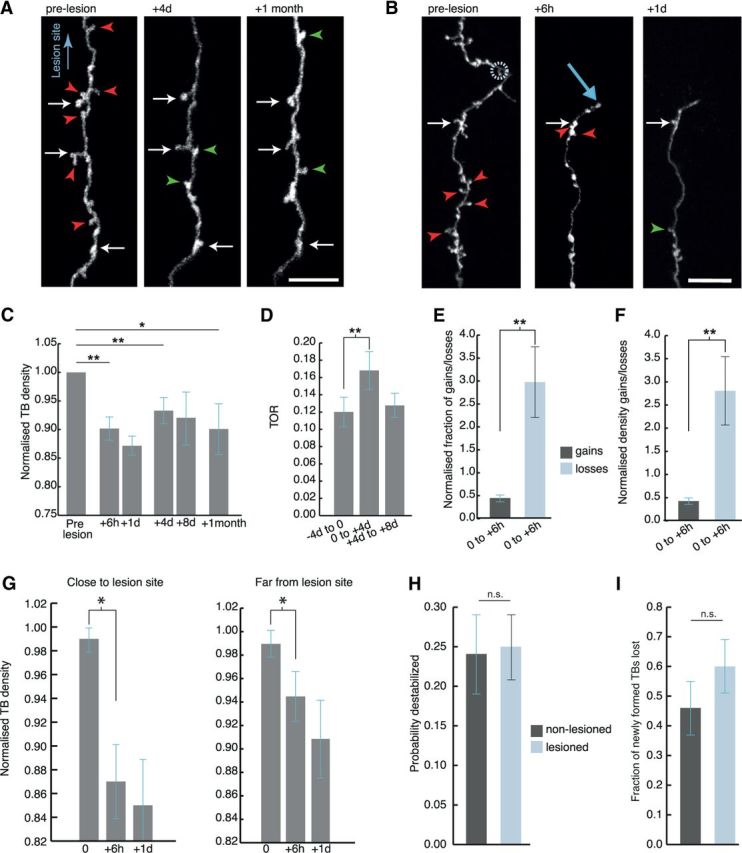
Figure 4.

Rapid and persistent synaptic loss after axotomy on L6 axons. A, B, L6 axons demonstrate a rapid loss of TB synapses from as early as 6 h postlesion, which is maintained for at least 1 month. Synaptic loss is evident both further away from the lesion (A), and close to the lesion site (indicated by a circle in B); light blue arrow indicates axonal stump. C, When normalized to the average of pre lesion synaptic density, quantification of synaptic loss indicates a significant reduction in TB density along the surviving axon by 6 h (p = 0.004), which persists at 1 d (p = 0.002), 4 d (p = 0.007), and 1 month postlesion (p = 0.02). D, TB turnover (TOR) increased significantly (p = 0.007) in the first 4 d postlesion, and returned to baseline levels 4 d later. E, F, Further analysis indicated that the increased fraction (p = 0.004) and density (p = 0.003) of losses (pale blue) compared with synaptic gains (dark gray) was significant from 6 h postlesion. G, TB density significantly decreases both close (within 250 μm from the lesion site, day 0 = 0.99 ± 0.01, +6 h = 0.87 ± 0.04, +1 d = 0.85 ± 0.04; p = 0.02 between 0 and +6 h) and far from the lesion site (following 250 μm, day 0 = 0.99 ± 0.01, +6 h = 0.94 ± 0.02, +1 d = 0.91 ± 0.03; p = 0.03 between 0 and +6 h). Data normalized to prelesion density. H, TBs present for all the prelesion time points are not affected by the lesion. I, The fraction of TBs which were newly formed in the week before the lesion and then lost before the end of the imaging paradigm increases after the lesion. White arrows in A, B indicate stable synaptic boutons, red arrowheads indicate losses, and green arrowheads indicate gains. Error bar represents the SEM. *p < 0.05, **p < 0.01 (Wilcoxon signed-rank test); n.s., nonsignificant. Scale bars, 10 μm.
