Figure 5.
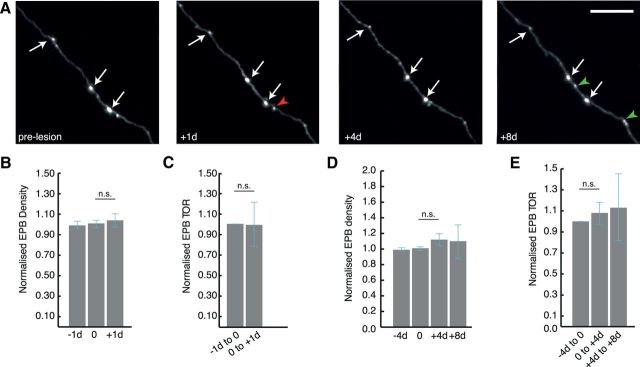
Stability of L2/3/5 and TCA axonal boutons after axotomy. A, Representative example of in vivo time lapse imaging showing stable EPBs on L2/3/5 and TCA cells. B, D, Normalized synaptic density of EPBs does not significantly change at +1 d (p = 0.75), +4 d (p = 0.25), or +8 d (p = 0.57) postlesion. C, E, Similarly, there is no significant change in TOR of EPB synapses at either 1 or 4 d intervals postlesion. White arrows in A indicate stable synaptic boutons, red arrowheads indicate losses and green arrowheads indicate gains. n.s., nonsignificant. Scale bar, 10 μm (A).

