
Figure 1.
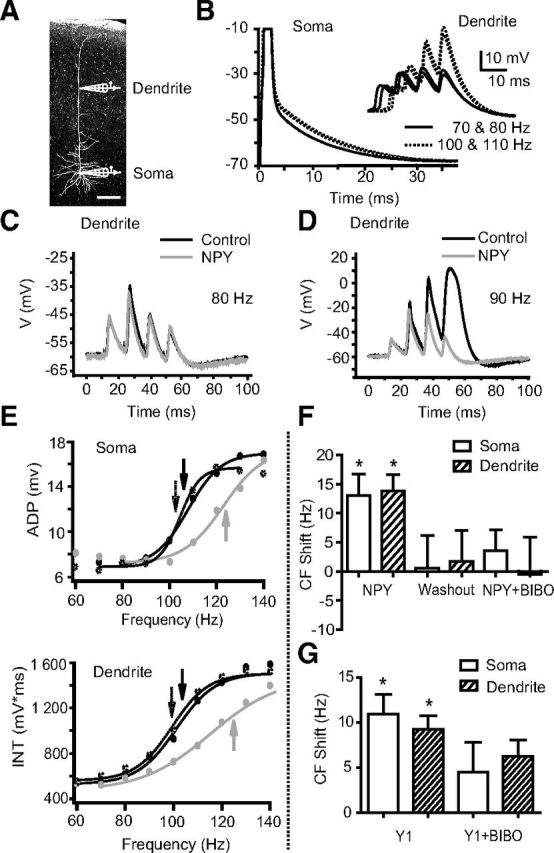
NPY increases the CF in L5 PNs. A, A neurobiotin-filled L5 PN with representative somatic and dendritic (>500 μm from the soma) recording electrodes. Scale bar, 200 μm. B, CFs were studied using trains of four somatic APs (1 ms square pulses of 1–5 nA current injections at the soma). ADPs of the fourth AP recorded at the soma from trains of different frequencies are shown superimposed. Inset, Events recorded simultaneously at the distal dendrite of this neuron. Above the CF, supralinear responses were seen at the soma and dendrite (dotted lines). C, D, Compared to control responses (black traces), bath application of NPY (1 μm, gray traces) had little effect on dendritic responses to AP trains below the CF (80 Hz). Above the CF (∼90 Hz in this cell), NPY decreases the third and fourth dendritic depolarizations. E, Somatic ADP amplitudes (top) or the voltage-time integral (INT) for simultaneous dendritic recordings (bottom) from a representative L5 PN are plotted versus frequency (60–140 Hz shown here). Sigmoidal fits were used to determine the CF (arrows). NPY (1 μm; gray trace) increases the CF compared to control (black trace); this effect reverses upon washout (∼20 min; dotted trace). F, The average shifts in CF relative to control were calculated at the soma and dendrite after NPY application (n = 6), after washout of NPY and application of the Y1 antagonist BIBO 3304 (n = 6), and after a subsequent application of NPY in the presence of BIBO 3304 (n = 3). G, The average shifts in CF relative to control were calculated for the soma and dendrite after Y1 agonist application (F7P34[NPY], 1 μm; n = 3), and then with the agonist applied again after washout in the presence of BIBO 3304. *p < 0.05 (one-sample t test). Error bars indicate ±SEM.