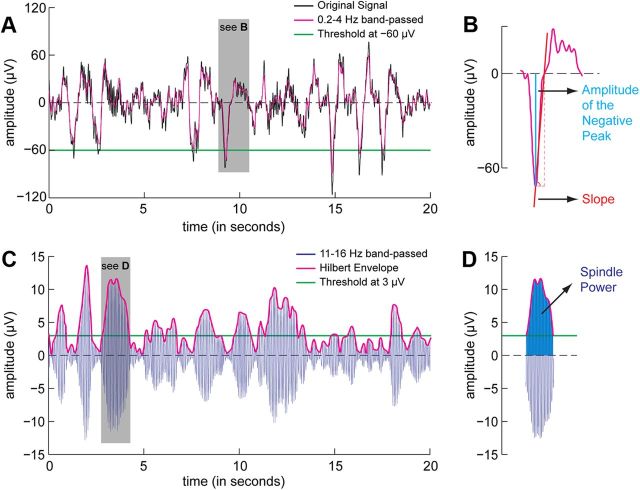
Figure 1.
Detection of slow-wave and spindle parameters. A, The black line shows a 20 s segment of sleep EEG referenced to the averaged mastoids. After 0.2–4 Hz bandpass filtering (purple line), a slow wave was detected when the amplitude of the negative peak was less than −60 μV (green line), the duration between two zero-crossings was between 0.2 and 1 s, and the negative peak-to-positive peak difference was >75 μV. B, Three parameters were used to describe slow-wave activity: (1) slow-wave density, which is the number of slow waves in a minute; (2) the amplitude of the negative peak (blue line); and (3) the steepness of the rising slope, which is the amplitude of the negative peak divided by the interval between the negative peak and the following zero crossing (red line). C, To quantify spindles, the original signal shown in A was bandpass filtered between 11 and 16 Hz (blue line) and Hilbert-transformed into its envelope (purple line). A spindle was detected when the envelope of the band-passed signal was higher than the absolute threshold of 3 μV (green line) for 0.5–2 s. D, Two parameters were used to describe spindles: (1) spindle density, which is the number of spindles per minute; and (2) spindle power, which is the area outlined by the envelope (dark blue).

