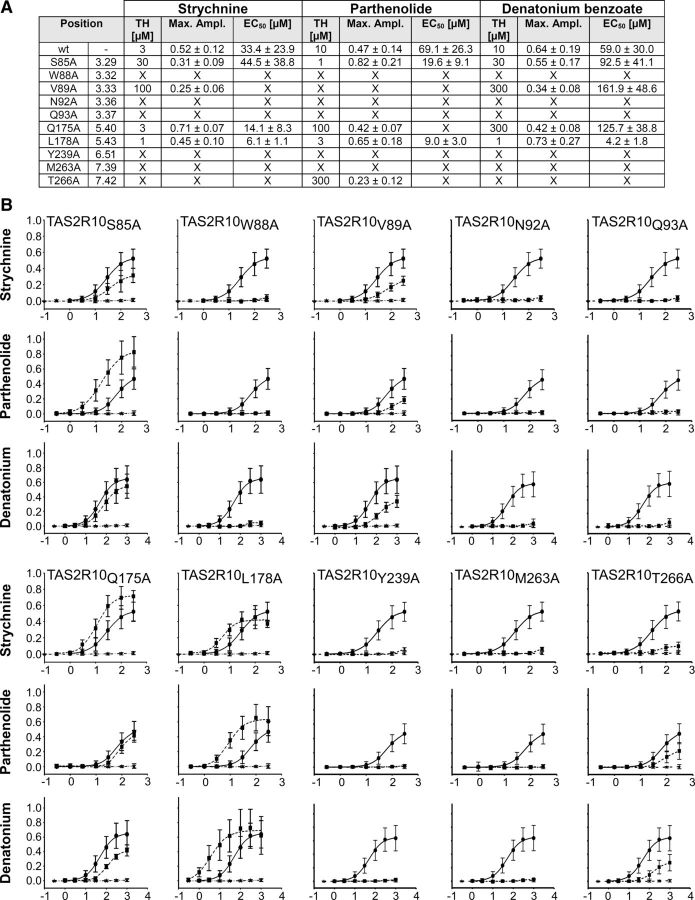
Figure 2.
Functional characterization of receptor constructs obtained by alanine-scanning mutagenesis. A, In the left columns, the mutated residue is indicated and its position according to the Ballesteros-Weinstein numbering system is given. For the agonists, strychnine, parthenolide, and denatonium benzoate, threshold concentrations (TH), maximal signal amplitudes as ΔF/F values (Max ampl), and EC50 concentrations are given. X = no statistically significant value above mock-control. B, Dose–response relations obtained for TAS2R10 mutants. Plots obtained for TAS2R10 wild-type (circles, solid lines), TAS2R10 mutants (squares, broken lines), and empty vector (stars, broken lines) are compared within each graph. y-Axis, relative changes in fluorescence (ΔF/F); x-axis, decadic logarithm of the agonist concentration given in μm.

