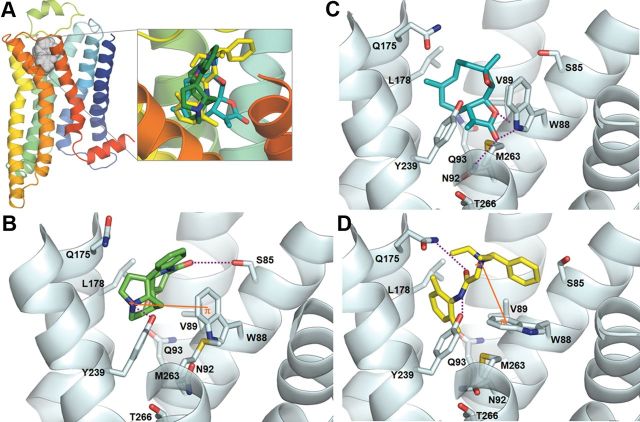
Figure 4.
Mode of interaction between TAS2R10 and strychnine, parthenolide, and denatonium benzoate. A, Homology model of TAS2R10 viewed perpendicular to the plasma membrane, with the extracellular side of the receptor shown on top and the intracellular side shown on the bottom of the figure. The structure is represented as ribbons and colored from the N-terminal (blue) to the C-terminal (red) amino acid sequence. The predicted binding site is shown in gray and is located among TMs III to VII. The inset shows an overlay of the three docked agonists in the binding site. B–D, The proposed docked conformations of strychnine (B), parthenolide (C), and denatonium (D) are shown in a side view. Agonists (strychnine, green; parthenolide, cyan; and denatonium, yellow) and receptor residues (light gray) involved in interactions are shown in stick representation. Dashed purple lines indicate hydrogen bonds; and orange lines, π-cation interactions. Part of TM IV is not shown for clarity.

