
Figure 3.
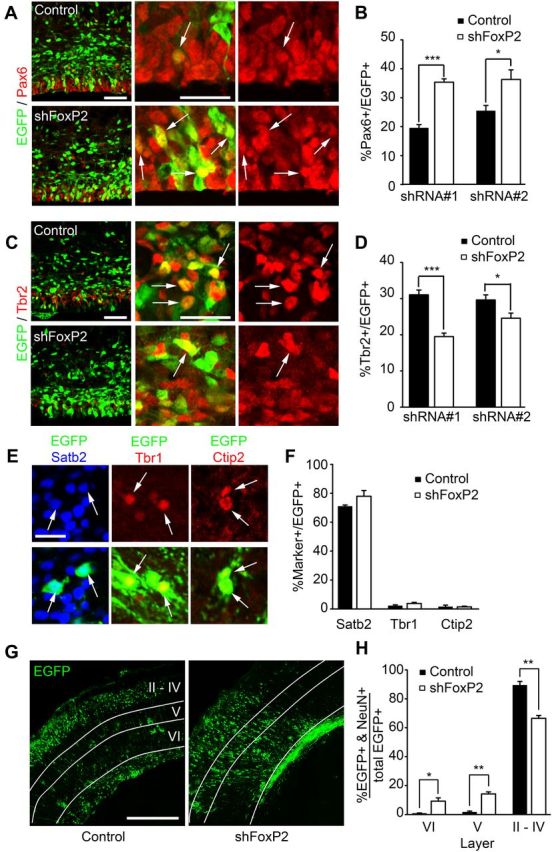
FoxP2 knockdown increases radial precursors at the expense of intermediate progenitors in the embryonic cortex. A–D, Murine cortices were electroporated at E13/14 with EGFP and control shRNA (Control) or FoxP2 shRNAs #1 or #2 (shFoxP2) and analyzed 3 d later. A, Confocal micrographs of coronal cortical sections from electroporated brains immunostained for EGFP (green) and Pax6 (red). Left, Low-magnification images of the VZ/SVZ of cortices electroporated with control shRNA (top) or FoxP2 shRNA #2 (bottom). Middle and right, High-magnification images showing EGFP-positive cells that are positive (arrows) for Pax6, with the middle panels showing the merges and the right panels Pax6 immunostaining only. Scale bar, 50 μm. B, Quantification of sections similar to those in A for the percentage of EGFP-positive cells that are also positive for Pax6. *p < 0.05; ***p < 0.001; n = 4 or 5 embryos each. C, Confocal micrographs of coronal cortical sections from electroporated brains immunostained for EGFP (green) and Tbr2 (red). Left, Low-magnification images of the VZ/SVZ of cortices electroporated with control shRNA (top) or FoxP2 shRNA #2 (bottom). Middle and right, High-magnification images showing EGFP-positive cells that are positive (arrows) for Tbr2, with the middle showing the merges and the right Tbr2 immunostaining only. Scale bar, 50 μm. D, Quantification of sections similar to those in C for the percentage of EGFP-positive cells that are also positive for Tbr2. *p < 0.05; ***p < 0.001; n = 4 or 5 embryos each. E–H, Murine cortices were electroporated at E13/14 with a PB transposon-based EGFP reporter and control shRNA (Control) or FoxP2 shRNA #2 and analyzed at P3. E, Confocal micrographs of coronal cortical sections electroporated with control shRNA (Satb2 and Ctip2) or FoxP2 shRNA#2 (Tbr1) and immunostained for EGFP (green) and Satb2 (left, blue), Tbr1 (middle, red), or Ctip2 (right, red; the bottom shows the merges). The Satb2 images are from the superficial cortical layers. Arrows denote double positive cells. Scale bar, 20 μm. F, Quantification of sections similar to those in E for the percentage of EGFP-positive cells that are also positive for Satb2, Tbr1, and Ctip2 (p > 0.05; n = 3 animals each). G, Confocal micrographs of coronal cortical sections from electroporated P3 brains immunostained for EGFP. The white lines distinguish the various cortical layers, in part as identified by immunostaining for Ctip2 (data not shown), which labels layer V cortical neurons. Scale bar, 400 μm. H, Quantification of sections similar to those in G for the percentage of EGFP-positive cells in the different cortical layers that also expressed NeuN. *p < 0.05; **p < 0.01; n = 3 animals each. Error bars indicate SEM.