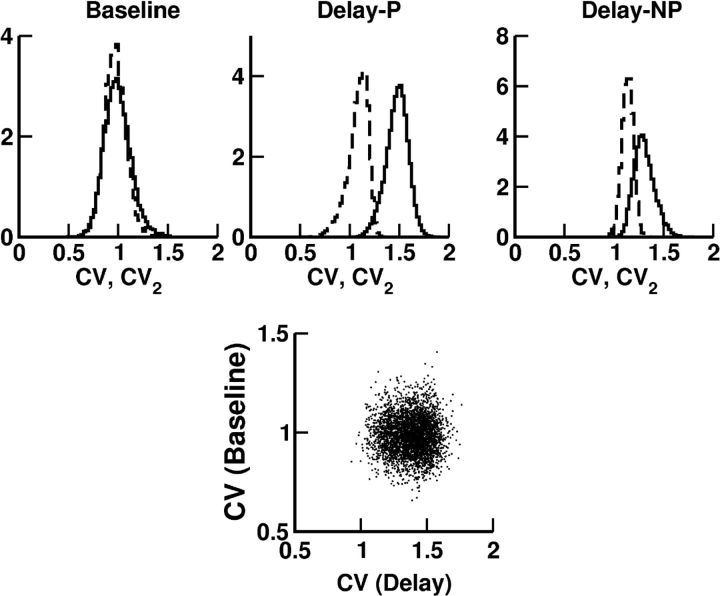
Figure 8.
Top, Histograms of the CV (solid line) and CV2 (dashed line) for activities during fixation (baseline), and delay periods. Delay-P, preferred directions. Delay-NP, nonpreferred directions. (see Materials and Methods). For each neuron, CV and CV2 were computed from 20 trials per cue direction. Only directions with average firing rate >2 Hz are included. Bottom, CV in baseline versus CV in delay for all the neurons.

