
Figure 2.
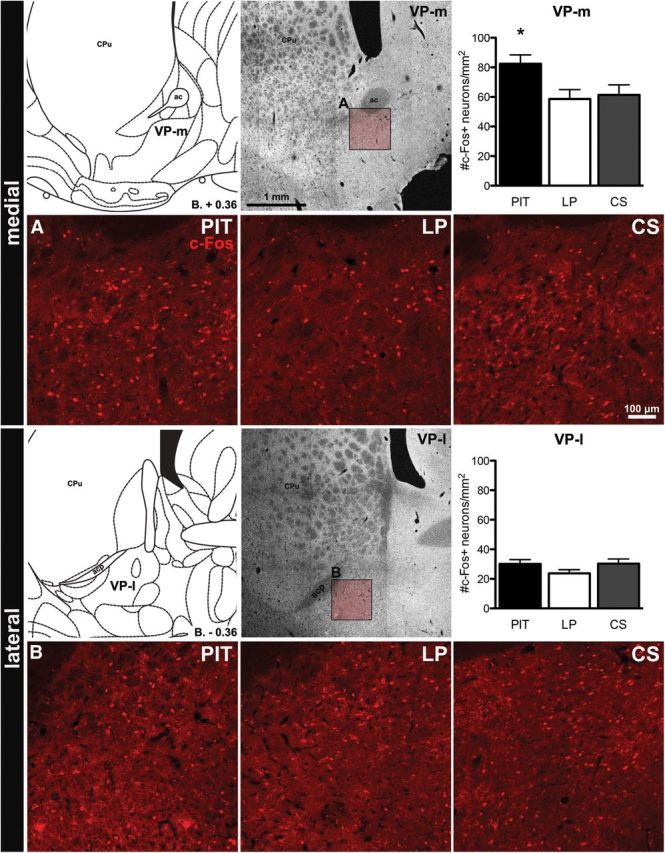
Experiment 1. c-Fos immunoreactivity in the VP-m (top) and VP-l (bottom). For each region, a schematic representation (Paxinos and Watson, 1998), a photomicrograph and quantification of c-Fos expression are displayed (top, left to right) with images of c-Fos immunoreactivity in each group (bottom, left to right). Insets in the photomicrograph show where images were taken for quantification in the VP-m (A) and VP-l (B). ac, Anterior commissure; acp, anterior commissure, posterior part; CPu, caudate–putamen. Error bars indicate SEM. *p < 0.05 compared with Groups LP and CS.