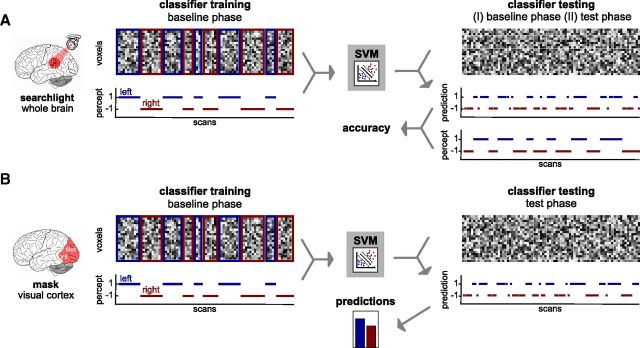
Figure 3.
Schematic illustration of the MVPA. A, MVPA searchlight analysis. For a given voxel in the brain, a local cluster of the surrounding voxels was defined. For each of the voxels in the cluster, the raw fMRI signal time courses were extracted, yielding a pattern activation matrix for each run, in which each line represents one voxel and each column one scan. Each column of this matrix was labeled according to the perceptual time course. The labeled pattern activation matrices from a subset of runs (I, 7 of 8 baseline runs; II, all baseline runs) were used to train a classifier (SVM). The trained classifier was then tested on an unlabeled pattern activation matrix from another independent subset of runs (I, remaining baseline run; II, all test runs) and predicted a perceptual state for each scan. Prediction accuracy was derived from the comparison of the predicted and the real perceptual time course. This procedure was repeated for every voxel in the brain, resulting in voxelwise accuracy maps. B, MVPA in visual cortex. From a mask comprising occipital lobe and functionally defined hMT/V5, selection was made of the 2000 voxels that were most informative about the perceived rotation direction in the training phase as defined by a t test. For each of these voxels, the raw fMRI signal time courses were extracted, yielding a pattern activation matrix for each run, in which each line represents one voxel and each column one scan. Each column of this matrix was labeled according to the perceptual time course. These labeled pattern activation matrices from all baseline runs were used to train a classifier (SVM). The trained classifier was then tested on an unlabeled pattern activation matrix from the test runs and predicted a perceptual state for each scan. The summed predictions for each of both rotation directions were then used to calculate the predicted effect of beliefs.

