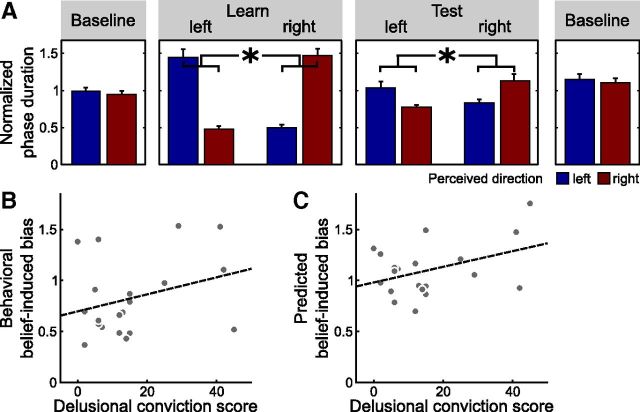
Figure 4.
Delusional ideation and belief-induced bias in the fMRI experiment (n = 20). A, Effect of beliefs on reported perception (*p < 0.001, paired t test, p value based on 10,000 permutations). Bars show the mean phase duration of each percept normalized with respect to the mean phase duration in the baseline runs. Error bars denote SE. B, Correlation between tendency toward delusional convictions and belief-induced bias as reported by the participants (r = 0.34, p = 0.08, product-moment correlation, p value based on 10,000 permutations). Behavioral belief-induced bias was calculated as the ratio of reported belief-congruent and belief-incongruent mean phase durations in the test phase normalized with respect to the learning phase. Tendency toward delusional convictions was measured with a validated questionnaire (Peters et al., 1999). Each dot represents one participant. The dashed line illustrates the fitted regression line. C, Correlation between tendency toward delusional convictions and belief-induced bias as predicted by MVPA in visual cortex (r = 0.40, p = 0.04, product-moment correlation, p value based on 10,000 permutations). An optimized classifier was trained on the baseline runs to predict perception from fMRI activation patterns in visual cortex (compare main text) and tested on the test and learning runs. Predicted belief-induced bias was then calculated as the ratio of predicted belief-congruent and belief-incongruent mean phase durations in the test phase normalized with respect to the learning phase. Each dot represents one participant. The dashed line illustrates the fitted regression line.

