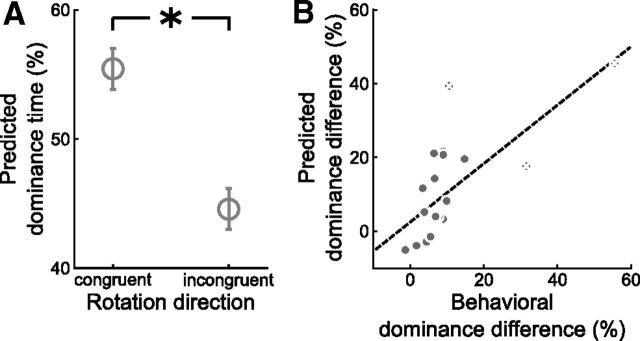
Figure 6.
Effect of experimentally induced beliefs on neural correlates of perceived motion direction in visual cortex as revealed by MVPA. A, Mean cumulative dominance times predicted by the classifier for the belief-congruent versus the belief-incongruent rotation direction during the test runs. Error bars denote SEM. *p < 0.005, two-tailed paired t test. B, Correlation of the behavioral and the dominance difference predicted by the classifier (r = 0.70, p < 0.001, product-moment correlation, p value based on 10,000 permutations). Dominance difference was calculated as the difference between dominance times for the belief-congruent and the belief-incongruent rotation direction. Each gray dot represents one participant. White crosses mark three potential outliers that deviated >2 SDs from the group mean in the behavioral or predicted dominance difference. The dashed line illustrates the fitted regression line for the entire group. Exclusion of the three potential outliers yielded similar results.

