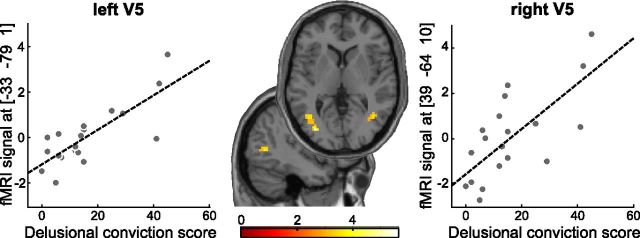
Figure 8.
Correlation of delusions and belief-related connectivity between OFC and bilateral hMT/V5 in test phase (left r = 0.49, p = 0.003; right r = 0.44, p = 0.035, both FWE-corrected). Axial and sagittal slices show voxels in which the psychophysiological interaction [OFC × (belief-congruent − belief-incongruent perceptual switches)] correlated with the conviction score from a validated delusions questionnaire (Peters et al., 1999). For display purposes, t maps are thresholded at p < 0.005, k > 5 voxels.

