
Figure 10.
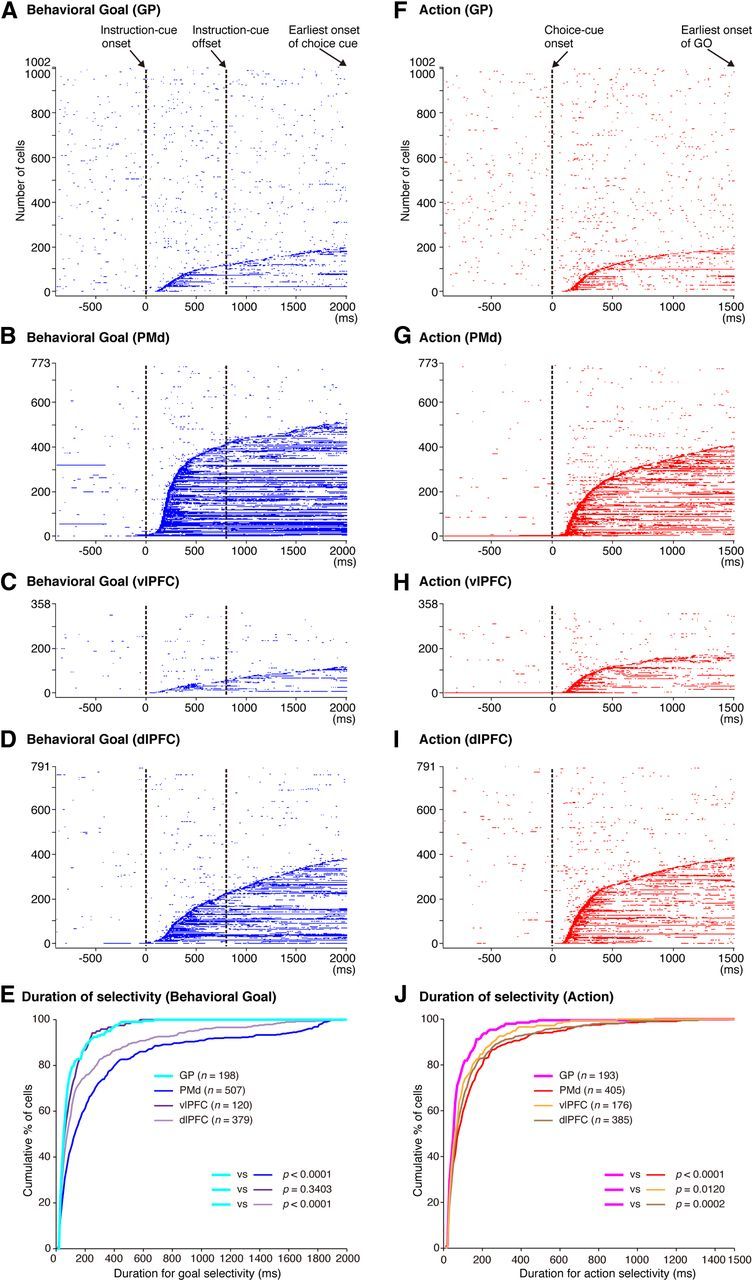
Temporal profiles of neuronal selectivity for behavioral goals and actions in the symbolic cue task. A–D, Time of appearance of goal selectivity in individual neurons in the GP (A), PMd (B), vlPFC (C), and dlPFC (D), plotted along the behavioral task period. The blue dots indicate the time points at which each neuron was selective for the goals. Each row represents a neuron. Neurons were sorted according to the onset of goal selectivity after the instruction-cue onset, from bottom to top. E, Cumulative fractions of the duration of goal selectivity after the instruction cue onset in the GP (light blue), PMd (dark blue), vlPFC (dark purple), and dlPFC (light purple) in the symbolic cue task. F–I, Time of appearance of action selectivity in the GP (F), PMd (G), vlPFC (H), and dlPFC (I). The red dots indicate the time points at which each neuron was selective for the actions. Each row represents a neuron. Neurons were sorted according to the onset of action selectivity after the choice-cue onset, from bottom to top. J, Cumulative fractions of the duration of action selectivity after the choice cue presentation in the GP (pink), PMd (red), vlPFC (orange), and dlPFC (brown) in the symbolic cue task. E, J, The parentheses enclose the number of neurons with the onset of selectivity ≤2000 ms after the instruction-cue onset (for goal selectivity, E) and ≤1500 ms after the choice-cue onset (for action selectivity, J). The p values indicate the results of the statistical analysis conducted with these neurons (Kolmogorov–Smirnov test) examining differences between the GP and the three cortical areas.