
Figure 2.
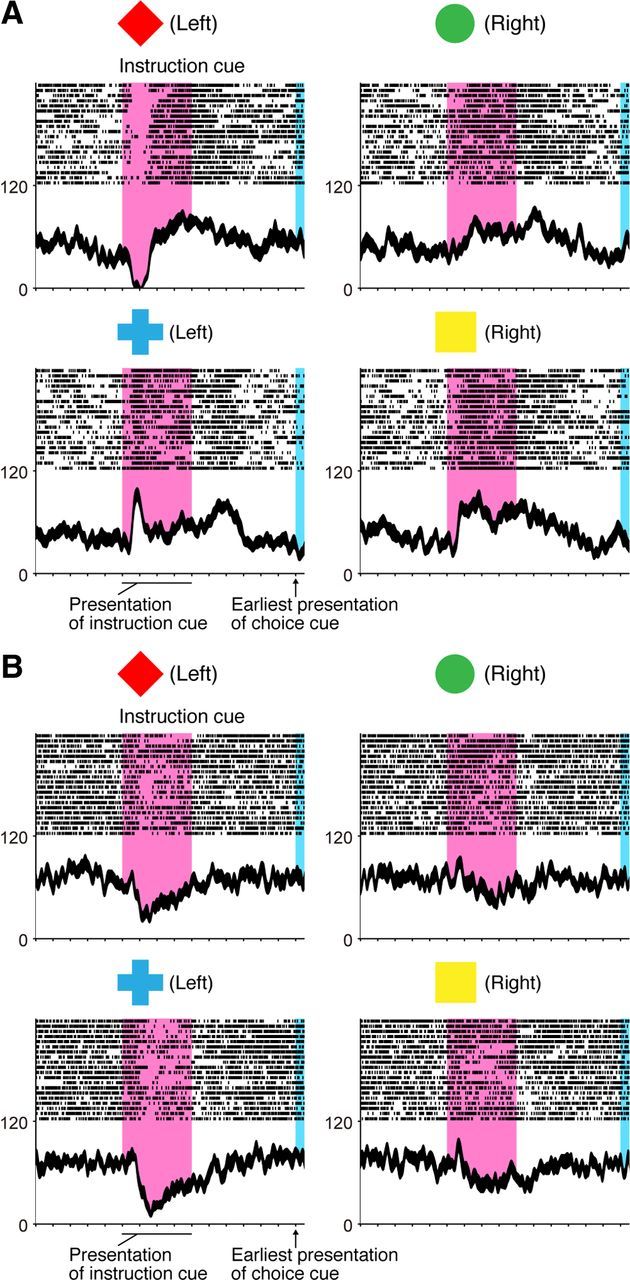
Representative neurons selective for a visual object (A) and behavioral goal (B) in the symbolic cue task. A, Activity of this GP neuron decreased when a red diamond was presented, whereas it increased when a blue cross was presented as an instruction cue. B, Activity of this GP neuron decreased when either a red diamond or a blue cross was presented. A, B, Neuronal activity was sorted according to the visual object identity. Rasters and spike density functions (smoothed using a Gaussian kernel; σ = 10 ms, mean ± SEM) indicate activity in sorted trials. The ordinate represents the instantaneous firing rate (in spikes/s). Neuronal activity was aligned with the onset of the instruction cue. The pink areas on the left indicate when the instruction was presented, and the blue areas on the right represent the earliest presentation period of the choice cue. The tick marks on the horizontal axis are placed at 200 ms intervals.