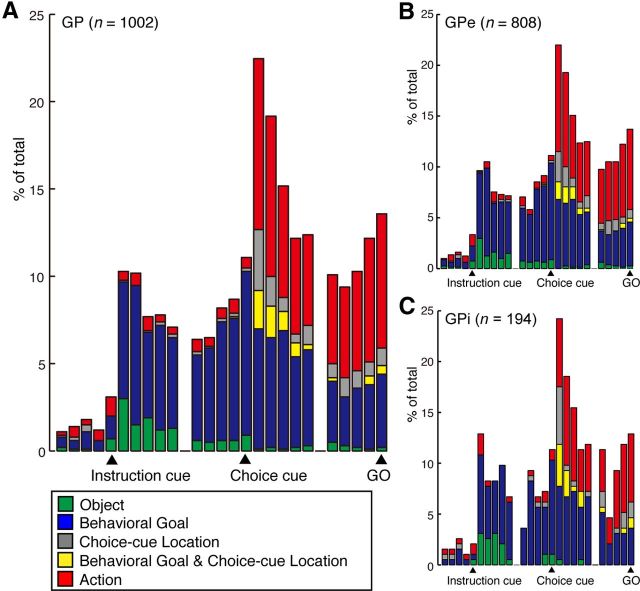
Figure 4.
Temporal profiles of the number of selective GP neurons in the symbolic cue task. A, The histogram shows the time course of the appearance of neurons exhibiting each type of selectivity for the total GP neurons. B, C, Histograms show the same set of data as in A separately for the GPe (B) and GPi (C). The bin width is set to 200 ms. Each category is color-coded: the object (green), behavioral goal (blue), choice-cue location (gray), mixed selectivity for the behavioral goal and choice-cue location (yellow), and action (red). Bins are centered at the instruction-cue onset, choice-cue onset, and GO onset.

