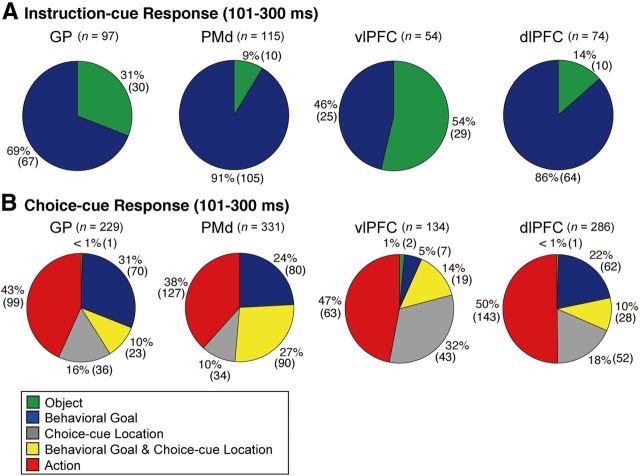
Figure 5.
Distribution of selective neurons in the GP, PMd, vlPFC, and dlPFC. Pie charts summarize the proportion of neurons classified into five categories using an ANOVA. Two sets of data are shown during 101–300 ms after the onset of instruction (A) and during 101–300 ms after the onset of choice cue (B). Each category is color-coded, which is indicated in the inset. Green, object neurons; blue, goal neurons; gray, neurons selective for the choice-cue location; yellow, neurons selective for both goal and choice-cue location; red, action neurons.

