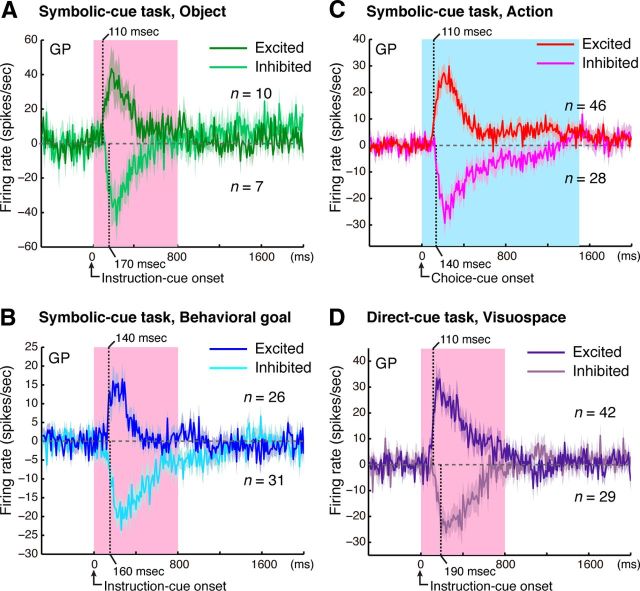
Figure 6.
Development of selective responses. Time courses of object selectivity (A), behavioral goal selectivity (B), action selectivity (C) in the symbolic cue task, and visuospatial selectivity in the direct-cue task (D). Bin-by-bin plots of the mean activity modification (±SEM) were calculated as the difference in activity for the preferred and nonpreferred cases. Analyses were performed for neurons exhibiting selective responses after presentation of the instruction cue (A, B, D) or choice cue (C). Dark green (A), blue (B), red (C), and purple (D) lines represent excited responses; and light green (A), light blue (B), pink (C), and light purple (D) lines represent inhibited responses. A, B, D, Pink areas indicate when the instruction cues were presented. C, Blue areas indicate the minimum period of choice-cue presentation. Translucent ribbons around the solid line indicate ±SEM. Each vertical dotted line represents the onset latency: a point at which the selectivity exceeds the mean ± 4 SD of the baseline period (500 ms period preceding the cue onset).

