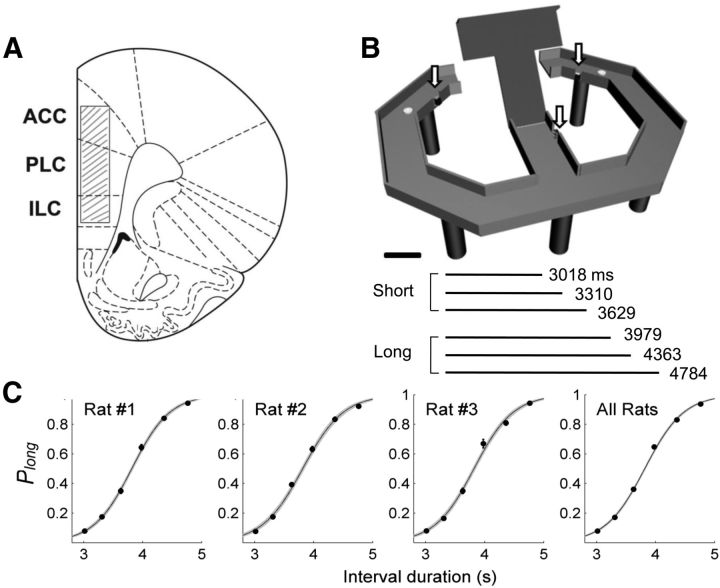
Figure 1.
Recording sites, behavioral task, and behavioral performance in Experiment 1. A, Activity of single neurons was recorded from the dorsal ACC, prelimbic cortex (PLC), and infralimbic cortex (ILC), as indicated by shading. The diagram is a coronal section view of the brain (2.7 mm anterior to bregma). Modified with permission from Elsevier (Paxinos and Watson, 1998). B, Temporal bisection task. One of six different time intervals was presented to the animal in each trial, and the animal had to navigate to either goal location (white circles) depending on the duration of the sample interval (short vs long). The arrows indicate photobeam sensors. Scale bar, 10 cm. C, The graphs show the fraction of long-target choices (Plong) as a function of sample interval duration. The solid lines were determined by logistic regression and the shading indicates 95% confidence interval. Error bars, SEM.

