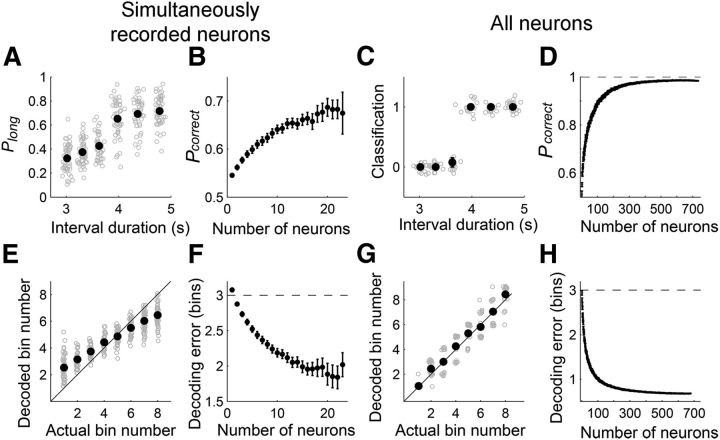
Figure 10.
mPFC neuronal ensemble conveys temporal information. A–D, Classification of sample intervals into short and long intervals based on simultaneously (A, B) or all (C, D) recorded units. A, Gray, Probability to classify sample intervals into long ones as a function of sample interval duration in one session. Black, Their mean and SEM across sessions. B, Results of a neuron-dropping analysis for A, showing the relationship between the size of neuronal ensemble and the fraction of correct decoding (Pcorrect). C, Gray, Results of trial-by-trial classification (0, short interval; 1, long interval). Black, Their mean and SEM. D, Results of a neuron-dropping analysis for C. E–H, Neural decoding of elapsed time. The longest sample interval (4784 ms) was divided into 10 equal-duration bins, and the order of the middle eight bins was decoded based on the activity of simultaneously (E, F) or all (G, H) recorded units within each bin. E, Gray, Mean decoded bin number for each bin for one session. Black, Their mean and SEM across sessions. F, Results of a neuron-dropping analysis for E, showing the relationship between the size of neuronal ensemble and mean decoding error (mean distance between the actual and predicted bins). The horizontal dashed line denotes the chance level. G, Gray, Trial-by-trial decoding results for each bin. Black, their mean and SEM across trials. H, Results of a neuron-dropping analysis for G. Error bars are too small to see in A, C, E, and G. Decoding results based on a single session (24∼35 units) are not shown in B and F.

