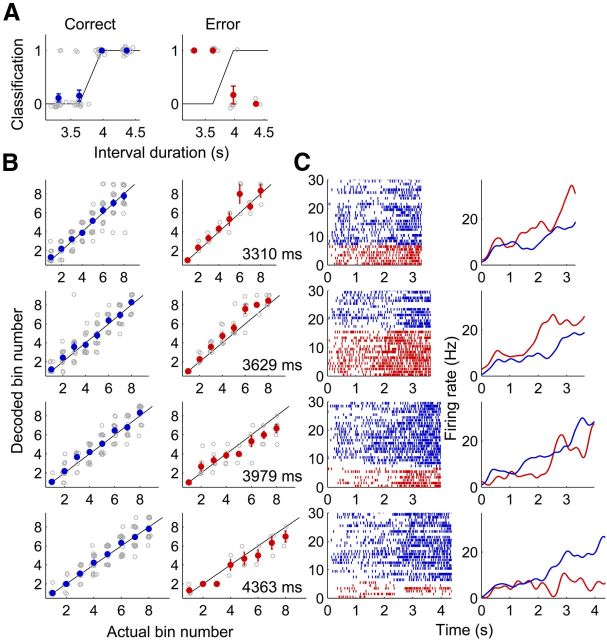
Figure 13.
Comparison of neural activity during correct and error trials. The longest and shortest sample intervals were excluded from the analysis because of small numbers of error trials. A, Classification of sample intervals into short and long ones based on activity of all recorded units (n = 733) during correct (blue) and error (red) trials. Same format as in Figure 10C. The lines represent perfect (100% correct) classification. B, Decoding of elapsed time based on activity of all recorded units during correct (blue) and error (red) trials. Same format as in Figure 10G. C, Spike raster plots and spike density functions (σ = 100 ms) for correct (blue) and error (red) trials are shown for an example neuron.

