Figure 15.
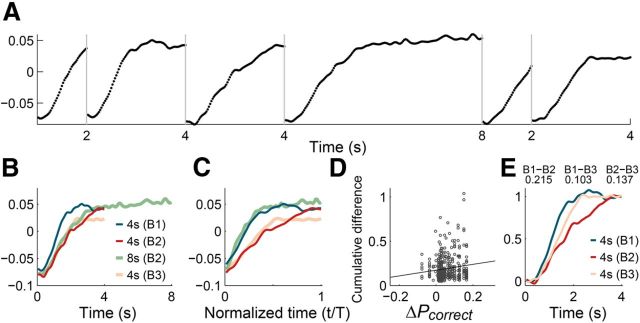
Neural activity during temporal discrimination with variable time ranges (Experiment 2). A, PC1 of neural activity during three blocks of trials. PC1 accounted for 21.2% of total variance in neural activity. The abscissa denotes time since the onset of each sample interval. B, PC1 for neural activity during the 4 s interval in each block (B1, Block 1; B2, Block 2; B3, Block 3) and PC1 for neural activity during the 8 s interval in the second block were compared. C, Same plot as in B except that the abscissa denotes normalized time [t/T, where T denotes the time range excluding the first 0.5 s (3.5 or 7.5 s)]. D, Relationship between behavioral performance and neural response. The abscissa indicates the difference in the fraction of correct choices (ΔPcorrect) and the ordinate indicates the difference in neural response (cumulative difference in neural activity during the 4 s interval) between the first and third blocks. The line was determined by linear regression (slope = 0.325, p = 0.014). E, Comparison of normalized PC1. PC1s for neural activity during the 4 s interval in Blocks 1 (B1), 2 (B2), and 3 (B3) were compared after normalizing baseline and response magnitude [normalized PC1 = (PC1 − B)/(E − B), where E and B denote the mean PC1 values during the last and initial 300 ms of the 4 s interval, respectively]. Numbers indicate cumulative differences (sum of root mean square values at 50 ms time resolution) between B1 and B2 (B1 − B2), B1 and B3 (B1 − B3), and B2 and B3 (B2 − B3) traces.

