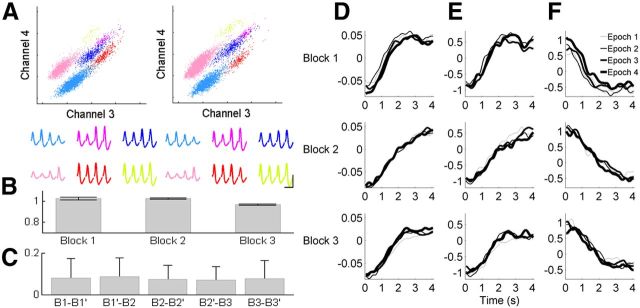
Figure 16.
Stability of neuronal activity in Experiment 2. A, An example of recorded unit signals during the first (left) and last (right) 5 min of a session. Each unit cluster is indicated in different color. Horizontal and vertical axes indicate the energy of spike signals recorded through channels 3 and 4 of a tetrode, respectively. Averaged spike waveforms recorded through four tetrode channels are shown below for each cluster in corresponding colors. Calibration: 1 ms, 0.1 mV. Only those unit clusters that were stably maintained throughout the entire recording session as shown in the example were included in the analysis. B, Stability of mean firing rates across blocks. Mean normalized firing rates (mean firing rate in each block was divided by overall mean firing rate for each neuron) across Blocks 1, 2, and 3 are shown. There was no significant variation across blocks (1-way ANOVA, p = 0.305). Error bars, SD. C, Index of firing rate change [|X − Y|/(X + Y) where X and Y are mean firing rates of a neuron during different epochs] between the first and second halves of Block 1 (B1 − B1′), between the second half of Block 1 and the first half of Block 2 (B1′ − B2), between the first and second halves of Block 2 (B2 − B2′), between the second half of Block 2 and the first half of Block 3 (B2′ − B3), and between the first and second halves of Block 3 (B3 − B3′). Particularly large changes in mean firing rate were not observed across Blocks 2 and 3. Error bars, SD. D, Stability of neural responses within each block. Neural activity during 4 s time interval in each block was analyzed. Each block was divided into four equal-trial epochs and PC1s for all four epochs were plotted together. E, F, The neurons were grouped into quintiles according to their PC1 loading values and mean normalized activity was plotted for each epoch as in D for the first (E) and last (F) quintiles of neurons.

