
Figure 7.
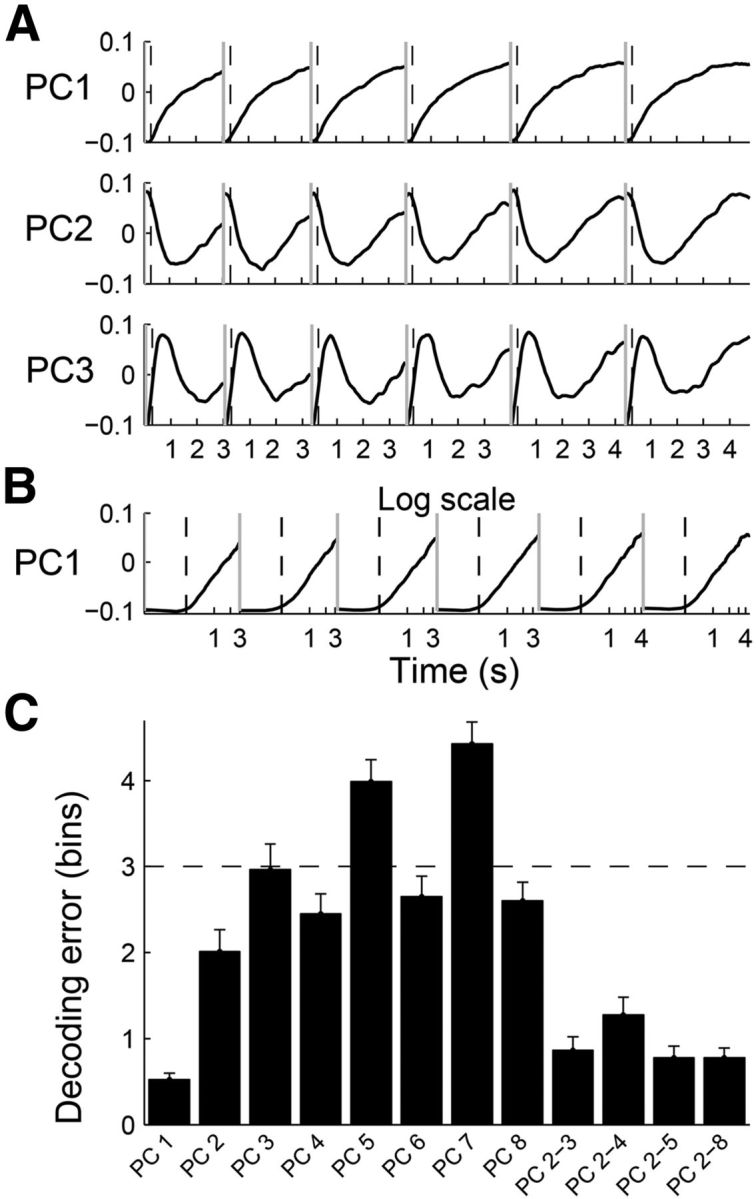
Results of PCA. A, Eigenvectors are shown for the first three principal components relative to the time of sample interval onset. They accounted for 30.9, 10.4, and 6.3% of total variance in neuronal activity, respectively. B, The eigenvector for PC1 was plotted on a logarithmic scale. The gray vertical lines indicate the onset of a time interval and the dashed vertical lines mark 300 ms following a time-interval onset. C, Mean error in the prediction of elapsed time based on individual PCs (PC1∼PC8, which explained >80% of total variance in neural activity) as well as their linear combinations are shown together. Shown are the results obtained from the analysis of the longest sample interval in Experiment 1 (4784 ms). Error bars, SEM.