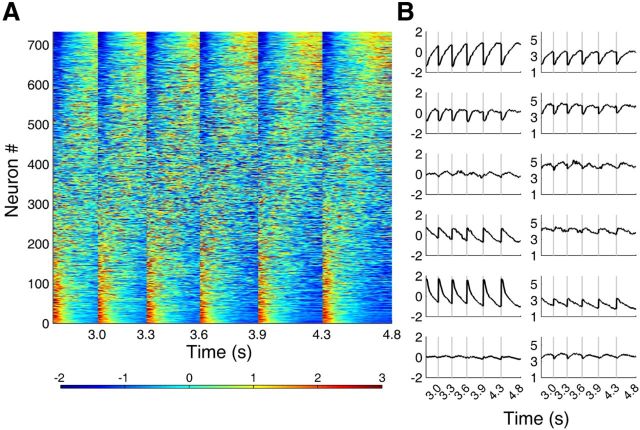
Figure 8.
Activity profiles of individual mPFC neurons. A, Temporal profiles of normalized activity (z-score) are shown for all analyzed neurons (n = 733) for each sample interval duration (from left to right, short to long) that were sorted according to PC1 loading value. Red and blue indicate neural activity above and below zero mean, respectively. B, All neurons were grouped into quintiles according to their PC1 loading values and their mean normalized activity (z-score, left) and SD (right) are shown for all six interval durations in 50 ms time bins. The bottom panels in B show mean normalized activity and mean SD for all neurons. The abscissa denotes time since the onset of each sample interval.

