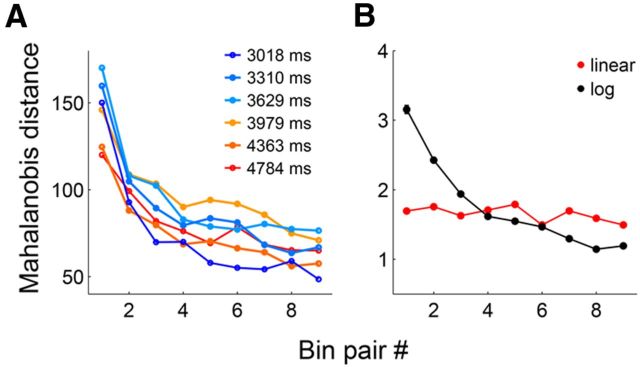
Figure 9.
Precision of temporal discrimination as a function of time. A, Mahalanobis distance was assessed between two adjacent bins (9 pairs total for each sample interval). B, Same as A except that simulated neural data obtained from linearly (red) or logarithmically (black) changing functions were analyzed for the longest sample interval (4784 ms). The error bars (SEM) are too small to see.

