Figure 7.
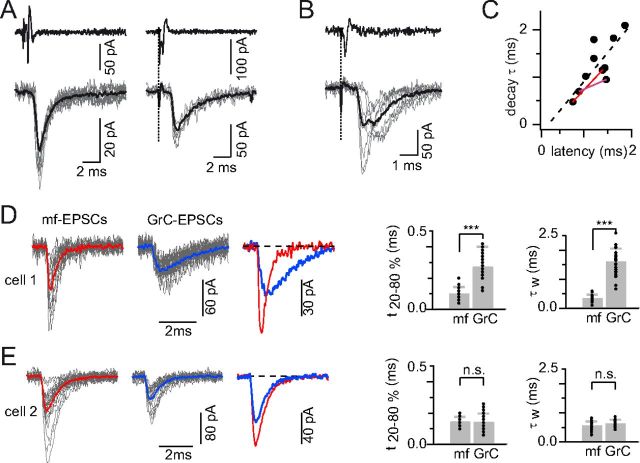
Similar numbers of GrC-EPSCs with fast and slow kinetics revealed by granule-Golgi paired recordings and extracellular stimulation recordings. A, Exemplar recordings from two different GrC-GoC pairs, illustrating fast (left) and slow (right) EPSC kinetics. Top, Loose-cell attached recordings of juxtacellular spike-induced current in two GrCs. Bottom, Simultaneous EPSCs (gray traces) and their averages (black traces) recorded in postsynaptic GoCs clamped at −70 mV. Decay time constant: 0.7 ms (bottom left) and 1.8 ms (bottom right). B, In another pair, presynaptic GrC spikes (top) evoke two distinct EPSC responses with different latencies. Bottom, Superimposed individual responses (gray traces) and their average (black trace). C, Scatter plot of the mean EPSC decay time constant versus latency from presynaptic spike in 8 paired recordings. Red lines connect measurements for 2 distinct EPSCs obtained in single pairs. The dashed line indicates the linear regression through all points (see Results). D, E, Kinetic properties of mf- and GrC-EPSCs evoked by extracellular WM stimulation in two exemplar GoCs (D, cell 1; E, cell 2). Traces: individual EPSCs (in gray) and their averages (in color) aligned at the time of 20% of rise. Left column: mf-EPSCs. Middle column: GrC-EPSCs. Averages are superimposed in the right column. Right, Summary plots of the 20–80% rise time (t20–80) and weighted decay time (τw; see Materials and Methods) of all mf- and GrC-EPSCs in cell 1 (D) and cell 2 (E). Gray bars indicate mean ± SD; dots, individual values. In cell 1, kinetic parameters indicate much slower GrC- than mf-EPSCs (t20–80, 0.3 ± 0.1 vs 0.1 ± 0.04 ms; τw, 1.6 ± 0.4 vs 0.3 ± 0.1 ms), whereas in cell 2 the two inputs are similarly fast (t20–80, 0.1 ± 0.05 vs 0.1 ± 0.03 ms; τw, 0.6 ± 0.1 vs 0.6 ± 0.2 ms). ***, p <0.0005; n.s., not significant.

