Figure 10.
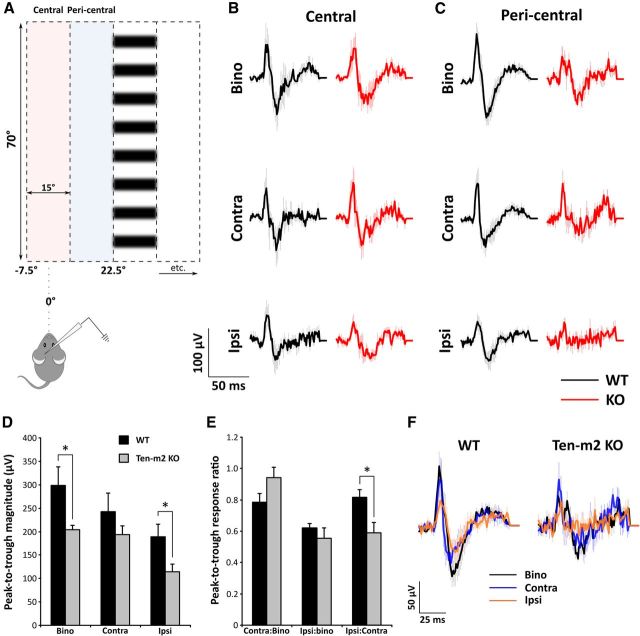
Differences in the level of activity observed across binocular (Bino), contralateral (Contra), and ipsilateral (Ipsi) VEP responses in Ten-m2 KO mice. A, Individual VEP recordings were averaged and compared across binocular, contralateral, and ipsilateral presentations of visual stimuli (vertical columns of drifting horizontal sine-wave gratings). B, For recordings made in lateral V1, stimuli situated centrally at the vertical meridian (−7.5 to 7.5°; pink shaded region in A) resulted in no significant differences between WT (n = 5) and Ten-m2 KO (n = 5) recordings. C, Several differences were found, however, from those VEPs elicited from the adjacent peripheral location of the contralateral visual field (pericentral, 7.5–22.5°; blue shaded region in A). B, C, Traces are averaged WT (black) and Ten-m2 KO (red) recordings with error bars indicating SEM. D, E, Quantification of pericentrally elicited VEPs revealed that while contralateral eye responses appeared unaltered, the magnitude (peak-to-trough) of binocular and ipsilateral VEPs (D) was significantly lower in Ten-m2 KOs (n = 6), compared with WTs (n = 10). This was further associated with a decrease in the ratio of ipsilateral-to-contralateral responses, when assessing peak-to-trough magnitude (E). *p < 0.05, Student's unpaired t test. F, A close alignment of averaged binocular (black), contralateral (blue), and ipsilateral (orange) responses was found for WT VEPs. This relationship was less evident for responses from Ten-m2 KOs.

