
Figure 4.
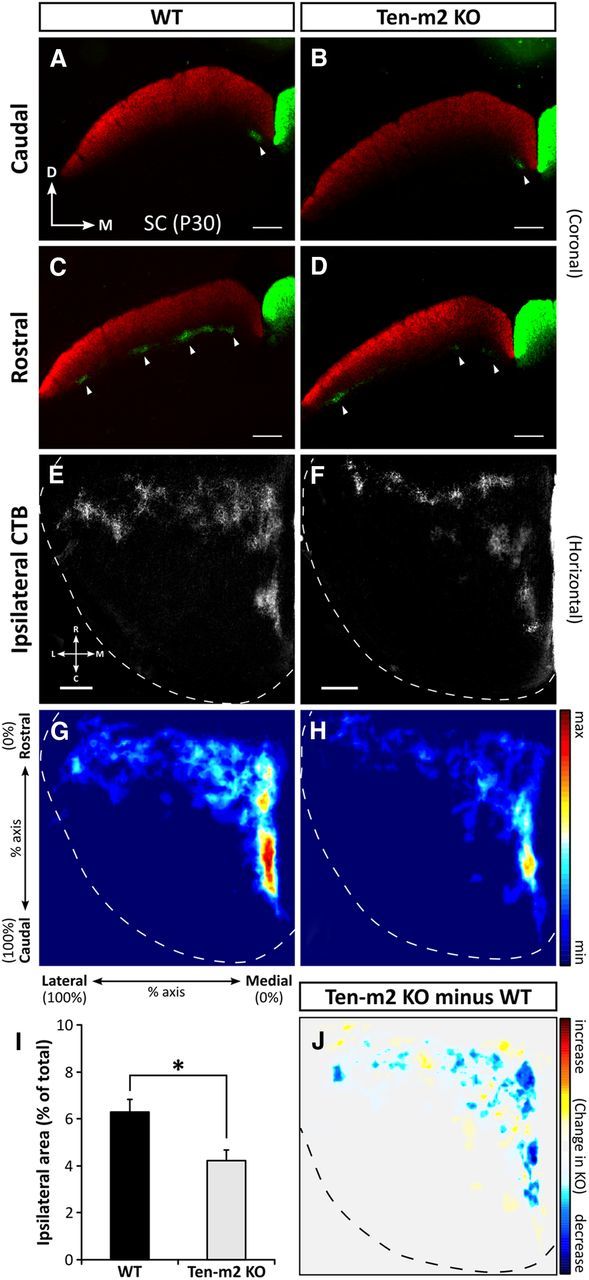
Alterations to retinocollicular projections are also observed in Ten-m2 KO mice. Following dual intraocular injections of fluorescently labeled CTB, coronal sections (A–D) through the SC show contralateral retinal projections (red) occupying the entire superficial, retinorecipient layers of the SC. In the same SC hemisphere, ipsilateral terminals (green) are segregated and situated deeper within stratum opticum (arrowheads) in both WT and Ten-m2 KO mice. In WT mice, ipsilateral inputs were restricted to medial locations in caudal SC (A), while they were variably distributed in clusters along the mediolateral axis of rostral SC (C). While no difference was seen caudally in KOs (B), there was evidence that ipsilateral inputs were decreased in Ten-m2 KOs (D) within rostral SC sections. For images in A–D, dorsal (D) is to the top and medial (M) to the right. Scale bar, 200 μm. E, F, Overall distribution of ipsilateral label was best demonstrated in horizontal sections through the SC (one hemisphere outlined), occupying a stereotypical rostromedial location in WTs (E). The proportion of the SC occupied by ipsilateral terminals was decreased in Ten-m2 KOs, compared with WTs (F). G, H, Distribution for each genotype is shown by composite heatmaps of ipsilateral label from each animal (n = 9 hemispheres for each genotype). Regions in red indicate high intensity of label, while blue regions indicate low levels of label. In Ten-m2 KO mice, ipsilateral label area was significantly reduced (I), most notably in medial SC (H). These changes are highlighted when WT signal is subtracted from KO signal (J), with blue regions showing where label is decreased in KO, with respect to WT. Images in E–J are in the horizontal plane with rostral to the top, and medial to the right. Scale bar, 250 μm. For heatmaps, signal is plotted along the percentage of the rostrocaudal and mediolateral axes of the SC; color scales are shown to the right. *p < 0.05, Student's unpaired t test.